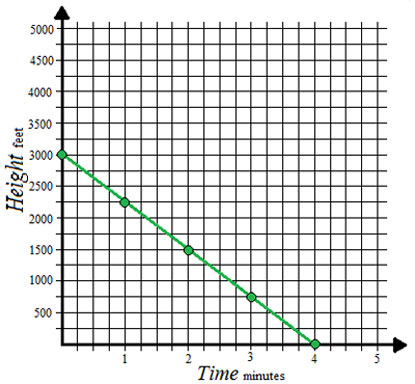
Marco has decided to try skydiving, and he is very nervous. He searched the internet for information, and downloaded the following graph. The graph shows the height of a typical skydiver in feet as related to the time in minutes after the parachute has opened.
Answer the following questions based on the information shown in the graph.
What is the height shown in the graph at a time of 2 minutes?
Interactive popup. Assistance may be required.
Check Your Answer
How did you know the height at 2 minutes from the graph?
Interactive popup. Assistance may be required.
Check Your Answer
What is the approximate height shown in the graph at a time of 1.25 minutes?
Interactive popup. Assistance may be required.
Check Your Answer
How did you know the height at 1.25 minutes from the graph?
Interactive popup. Assistance may be required.
Check Your Answer
At what time would the skydiver reach a height of 2500 feet?
Interactive popup. Assistance may be required.
Check Your Answer
How did you know the time from the graph?
Interactive popup. Assistance may be required.
Check Your Answer