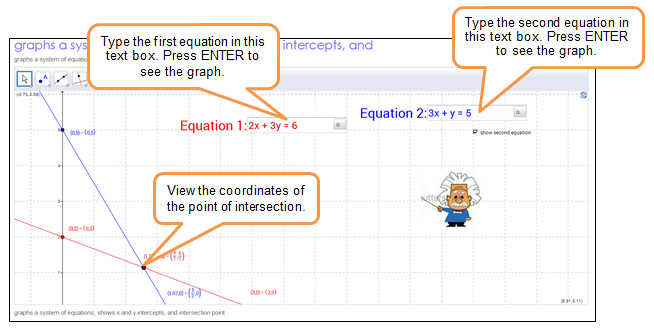
Use the interactive below to graph the two linear equations shown. Use your graph to answer the questions that follow.
In the last section, you reviewed how to graph lines when you were given the equation in slope-intercept form. In this section, you will graph two intersecting lines at the same time, and then look for patterns with the point of intersection.
Use the interactive below to graph the two linear equations shown. Use your graph to answer the questions that follow.
y = 2x − 5
y =
1 over 2
1
2
x + 1
Use the interactive to answer the questions below.
Interactive popup. Assistance may be required.
The coordinates are (4, 3), which means that x = 4 and y = 3.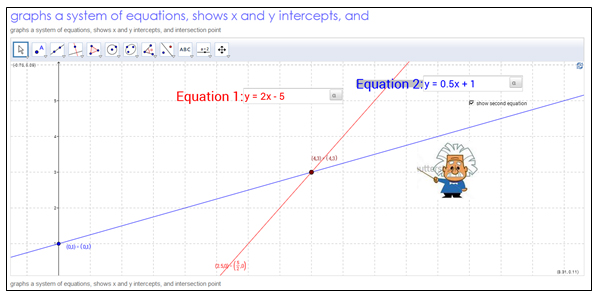

Interactive popup. Assistance may be required.
(3) = 2(4) − 5
Interactive popup. Assistance may be required.
(3) = 1 over 2 1 2 (4) + 1
Interactive popup. Assistance may be required.
Yes. When the x-value and y-value are substituted into the original equations, you get simplified equations that are true in both cases.
Interactive popup. Assistance may be required.
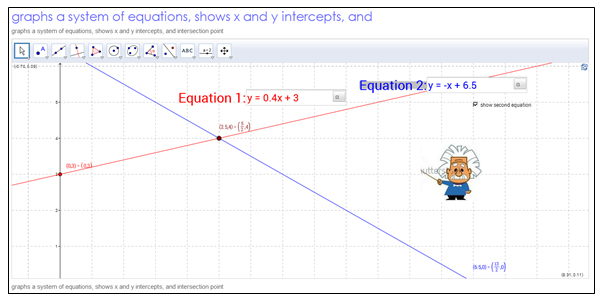
| (4) = 0.4(2.5) + 3 4 = 1 + 3 4 = 4 |
(4) = -(2.5) + 6.5 4 = -2.5 + 6.5 4 = 4 |
| The ordered pair (2.5, 4) is a solution to both equations. | |
When you graph two equations at the same time, the two equations are called simultaneous equations. How can you identify from the graph the solution to two simultaneous equations?
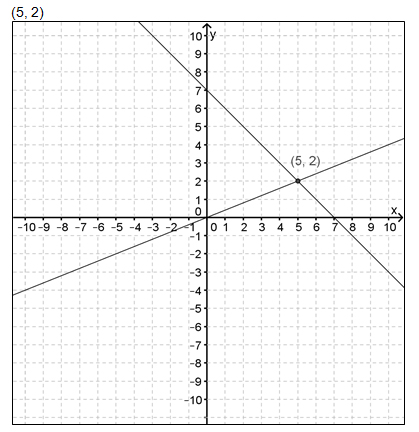
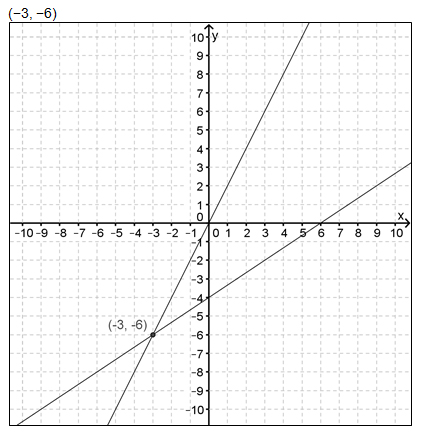
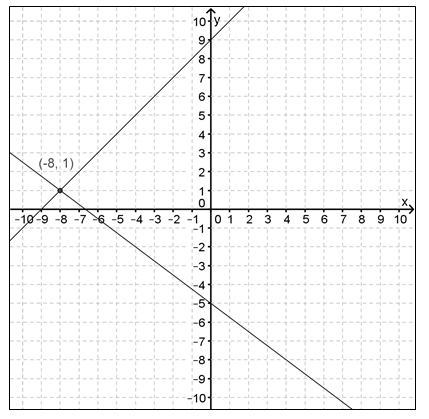
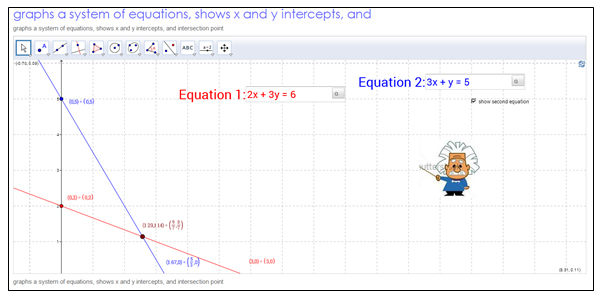
For each of the following pairs of simultaneous equations, graph the two equations. Then, use the graphs to determine the values of x and y that satisfy both equations at the same time.
Interactive popup. Assistance may be required.
Graph both equations by using the y-intercept as the starting point and the slope (as a fraction) to locate additional points. Locate the point of intersection.
Interactive popup. Assistance may be required.
Graph both equations by using the y-intercept as the starting point and the slope (as a fraction) to locate additional points. Locate the point of intersection.
Interactive popup. Assistance may be required.
Graph both equations by using the y-intercept as the starting point and the slope (as a fraction) to locate additional points. Locate the point of intersection.