
In previous grades, you learned how to calculate the mean, or arithmetic mean, of a set of numbers. In this section, you will review how to calculate the mean of a data set.
Consider the following problem.
A collection of shoes in a shoe store has the following shoe sizes.
6 61 over 2 1 2 61 over 2 1 2 7 7
8 9 91 over 2 1 2 10 10
What is the mean size of the shoes in the collection?
 Click on the Begin button to begin the animation below to see how Marley calculated the mean shoe size in the collection.
Graphically, you can locate the mean of a set of numbers on a number line. If you plot the data set on a dot plot, then the mean is a balancing point. In other words, if the number line was a balance beam, and each number was plotted with an object of equal weight, the number line would be perfectly balanced if the fulcrum were placed at the mean.
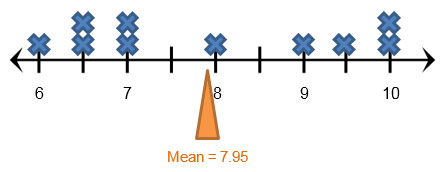
In our example above, the mean of 7.95, even though it’s not a shoe size, represents the balancing point for the set of shoes in the collection.
Summarize how you can calculate the arithmetic mean, or mean, of a set of seven numbers.
Interactive popup. Assistance may be required.
To calculate the mean, determine the sum of the data set, and then divide by the number of elements (numbers) in the data set.
Baseball Team Salaries (millions of dollars) |
|
Top Five Salaries |
Bottom Five Salaries |
33.00 24.35 22.80 20.33 16.45 |
0.47 0.45 0.43 0.44 0.41 |
What is the mean of the top five salaries for this baseball team?
City |
Average January Low Temperature (°C) |
Amarillo |
-5 |
Laredo |
8 |
Houston |
6 |
El Paso |
0 |
Texarkana |
1 |
San Antonio |
5 |
What is the mean of the average low temperatures for this set of Texas cities for the month of January?