In this lesson, you investigated mean absolute deviation, which is a statistical measure to describe the variability, or spread, of a data set.
The mean absolute deviation is the average of the differences (deviations) of each value in the data set from the mean of the data set.
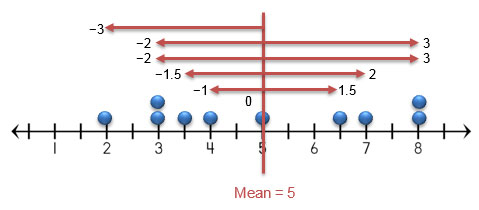
Graphically, the deviations can be represented on a number line from a dot plot.
Numerically, the absolute deviations can be represented using the absolute value. The mean is calculated by adding the absolute deviations together, and then dividing by the number of values in the data set.
|-3| + |-2| + |-2| + |-1.5| + |-1| + |0| + |1.5| + |2| + |3| + |3| = 19
19 ÷ 10 = 1.9