In previous grades, you learned how to use random samples to make inferences about a population.
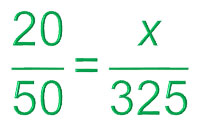
For example, suppose there are 325 eighth grade students at Sam Houston Middle School. A total of 50 eighth grade students were surveyed at random and 20 of those students said that they supported using clear backpacks for increased school safety. You can use this information to set up and solve a proportion to estimate how many of the 325 total eighth grade students would be likely to support using clear backpacks.
Before continuing in this lesson, it is important to understand two key terms about sampling.
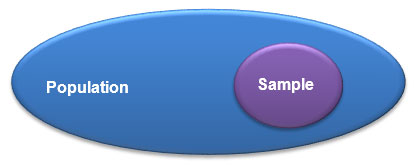
As the Venn diagram shows, the population is the entire group that is being studied. The most accurate way to describe the entire population is to study each member of the population, such as the way the United States census counts the nation’s population every 10 years. However, that is very expensive and takes a lot of time. Statisticians have shown that you can usually get good results by studying a random sample that is selected from within the population.
But how can you make sure that the sample really is random? How well does a randomly selected sample represent the population? In this lesson, you will use simulations to investigate these questions.