In previous grades, you used data from a random sample to make inferences and draw conclusions about a population. In this section, you will investigate different simulations that could be used to generate a random sample.
Consider the following problem.
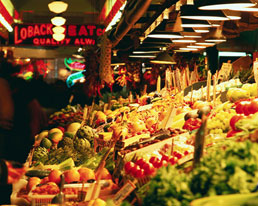
There are 100 pieces of fruit in Sidney’s Fruit Stand. Of those, there are 20 packages of blueberries, 40 pears, 25 apples, and 15 pineapples.
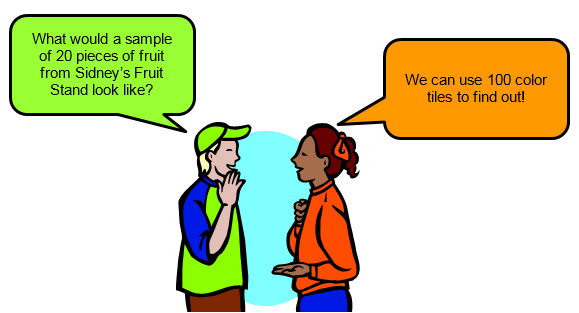
You can use color tiles to represent the fruit at Sidney’s Fruit Stand.
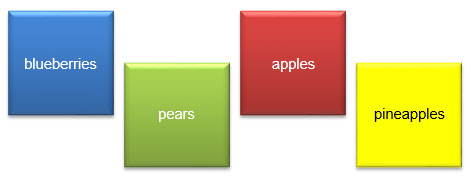
In the color tile simulation, you can place 100 color tiles in a bag and randomly select 20 of them. Each color tile selected would represent one fruit, and you could record the results.
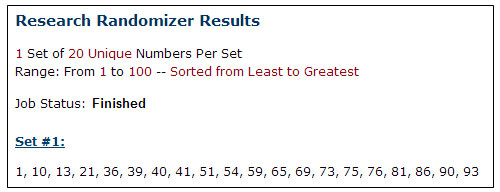
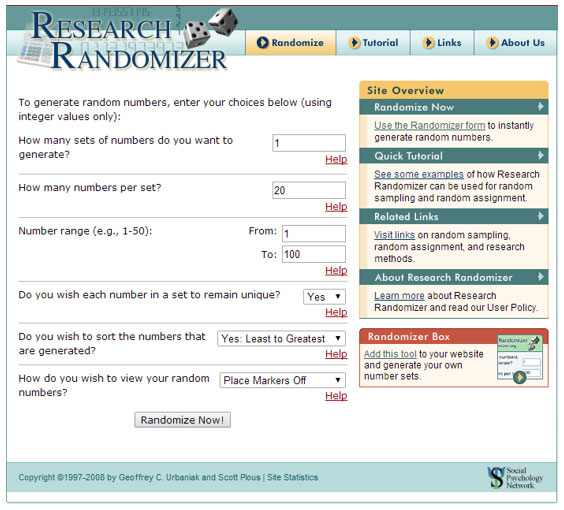
Another simulation could use a random number generator to select 20 random numbers between one and one hundred.
 Click the image below to use a random number generator to simulate the random sample. Enter the appropriate numbers in the boxes, then click Randomize Now! to generate the set of 20 random numbers.

How do the characteristics of the random sample compare to the characteristics of the population?
If you increased the size of the sample, how do you think that would affect the relationship between the characteristics of the random sample and the characteristics of the population?
Describe a simulation that could be used for each of the following situations.
Interactive popup. Assistance may be required.
If you used color tiles or a random number generator, how would you represent each coin in the collection (population)?
Interactive popup. Assistance may be required.
If you used color tiles or a random number generator, how would you represent each jersey in the league (population)?