In previous math courses, you learned about different measures of central tendency.
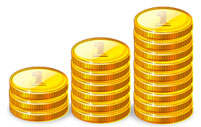
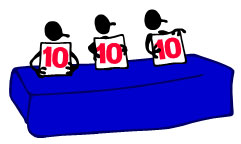
Mean is also sometimes called the average of a set of numbers. You can think of the mean as a "balancing point" for the data set. If you were to stack objects, like coins, to represent each number in the data set, and then redistribute the objects until each stack had the same number of objects, the mean is the number of objects that each stack would have.

Median is the midpoint for a set of numbers. If you listed the numbers in the data set in order from least to greatest, the median represents a point in the data set in which half of the numbers are lower, and half of the numbers are higher.
Mode is the number that occurs most often. Mode is a measure of frequency.
In this lesson, you will examine a set of data and select one of these measures of central tendency to describe the set of data for a given purpose.
It is important to be able to think about how the numbers in a data set are clustered together, but it is also important to know the variability of a data set, or how the numbers in the data set are spread out. In this lesson, you will also investigate two important measures of the spread of a data set.
Range is the difference between the lowest value and the highest value in a data set. Range tells you about the endpoints of your data set.
Quartiles are also used to describe a data set. A quartile tells you which number values separate your data set into 4 equally-sized parts.