
Three ways of describing a "typical" value in a set of numbers are to use mean, median, and mode. Each of these measures of central tendency tells you something different about the "typical" data set. Each of these measures is useful for different purposes. In this section of the lesson, you will investigate the three measures and decide for yourself which measure is most useful for which purpose.
Maribel's family is purchasing a new vehicle. With the price of gasoline constantly changing and becoming more expensive, they are very concerned about the fuel efficiency, or the number of miles driven per gallon of gasoline, of their new vehicle. Maribel did some research on the Internet to compare different vehicles that her family is considering.
Maribel made the following table to summarize her results:
| Vehicle | Mini Cooper |
Ford Fiesta |
Ford F150 |
Volkswagon Beetle |
Honda Civic |
Dodge Caliber |
Mitsubishi Lancer |
Toyota Corolla |
Chevrolet Malibu |
| Fuel efficiency (mpg) |
30 | 33 | 19 | 25 | 31 | 24 | 26 | 29 | 20 |
| Source: fueleconomy, mileage for 2012 model vehicles | |||||||||
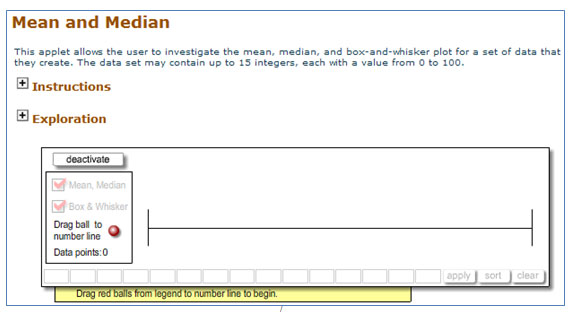
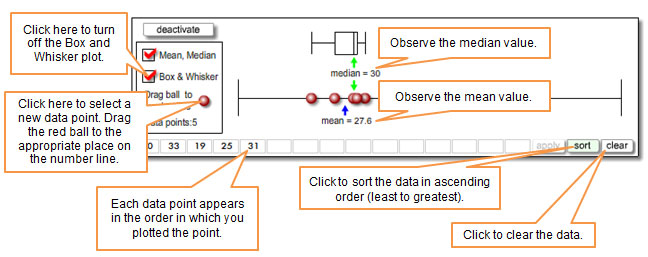
Use the number line interactive to plot each of these values on the number line. Click on the image below to access the interactive. The page will open in a new tab or window. The interactive will also calculate the mean and median value of the data set for you. Use what you observe to answer the questions that follow. Do not close the tab or window; you will add to this plot in the next sequence.


What are the median and mean values of the original 9 cars at which Maribel's family is looking?
Interactive popup. Assistance may be required. The median is 26 miles per gallon and the mean is 26.33 miles per gallon.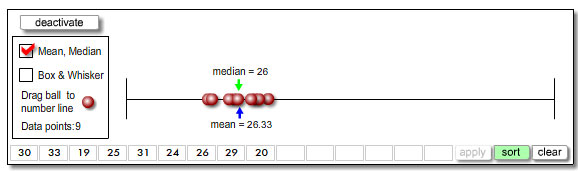
Interpret the median value in the context of Maribel's situation.
Interactive popup. Assistance may be required. The median is the point at which half of the data will be below and half of the data will be above.
Interactive popup. Assistance may be required.
Half of the vehicles have a fuel efficiency that is less than 26 miles per gallon, and half of the vehicles have a fuel efficiency that is more than 26 miles per gallon.
Interpret the mean value in the context of Maribel's situation.
Interactive popup. Assistance may be required. The mean is the "average" value; it is the sum of the data distributed evenly to the number of data points.
Interactive popup. Assistance may be required.
Of the vehicles being considered, each vehicle has a fuel efficiency of about 26.33 miles per gallon.
At the last minute, Maribel's mother decides to think about the Chevrolet Volt, which has a fuel efficiency of 94 miles per gallon since it is a gasoline/electricity hybrid vehicle. Add this value to your plot, and record the new mean and median.
Interactive popup. Assistance may be required. The median is 27.5 miles per gallon and the mean is 33.1 miles per gallon.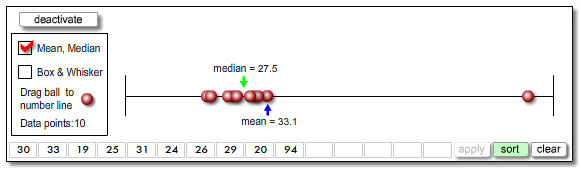
Which measure changed more when the new data value was added, the mean or the median? Why do you think that is the case?
Interactive popup. Assistance may be required. Remember that the median is the middle value of the data set, and the mean is the sum of all of the values redistributed evenly to all of the data points.
Interactive popup. Assistance may be required.
The mean changed more because of the new value that was added. Ninety-four is significantly more than the other data values, which are clustered around 27.5.
Interactive popup. Assistance may be required.
The mean will change more because the first 4 test scores cluster around 89, but the next score of 70 is very different from the other scores.