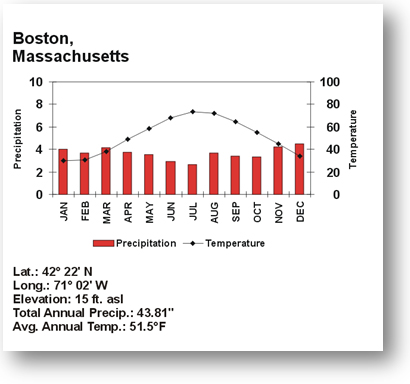
A quick way to get an idea of the climate of a particular place is to look at a "climate-graph," or climograph. A climograph is what scientists create to show a particular location's average temperature and precipitation during the year.
 To understand the climograph, scroll over each area of the image below.
Sources of images used for this section as they appear, top to bottom: