 Source: 2009 United States Population Estimates United States by State, U.S. Census
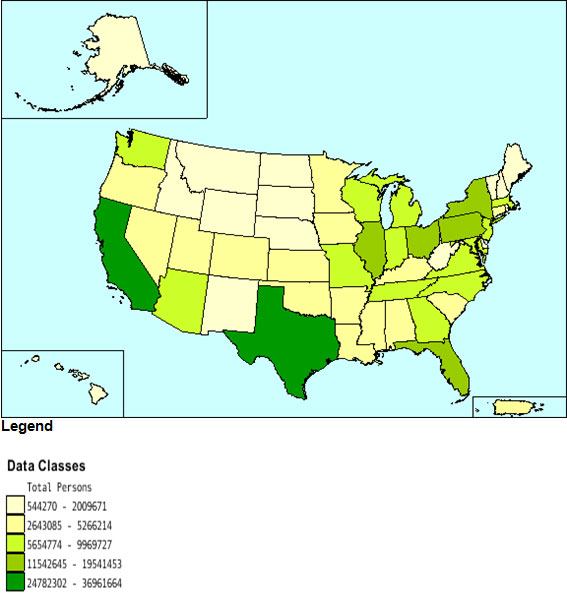
Examine the following maps and decide whether it illustrates population distribution or population density. Think carefully about what you have learned about each term and select the best answer choice.
2009 United States Population Estimates United States by State
Source: 2009 United States Population Estimates United States by State, U.S. Census
Interactive popup. Assistance may be required.

|
Interactive popup. Assistance may be required.
|
2009 United States Population Estimates - Persons per Square Mile
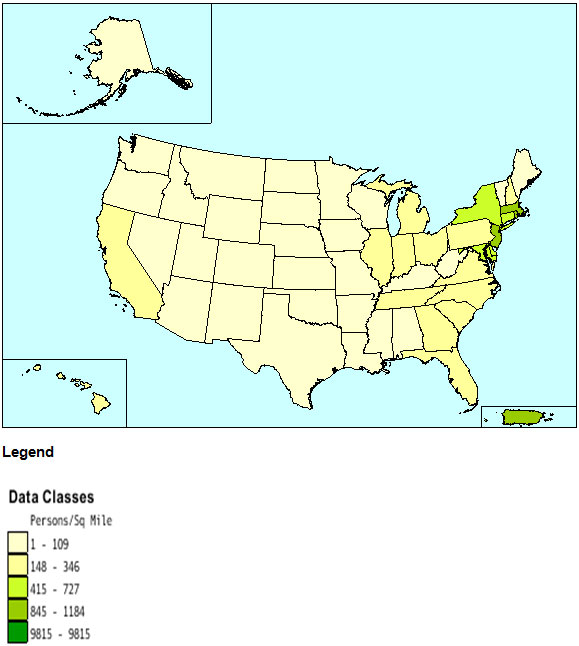 Source: 2009 United States Population Estimates- Persons per Square Mile, U.S. Census
Interactive popup. Assistance may be required.
|
Interactive popup. Assistance may be required.
|
Note the difference between the two maps, within the same area, density and distribution can look very different.