Source: United States Population Distribution, Travel Bug
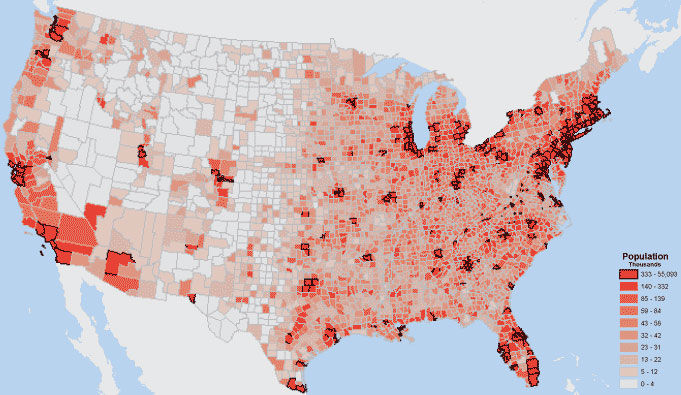
Analyze the United States Population Distribution map below. A population distribution map illustrates how the population is spread out (distributed) within an area. Most population distribution maps use a color scale to illustrate the distribution of a population.
(Notice the areas where the red is darkest represent counties with more people, so there is a higher population in these counties. The lighter red and white areas represent counties with a lower population, so fewer people reside there. )
United States Population Distribution (by counties)
Source: United States Population Distribution, Travel Bug
 Check Your Understanding: Answer the following questions to make sure that you understand settlement patterns.
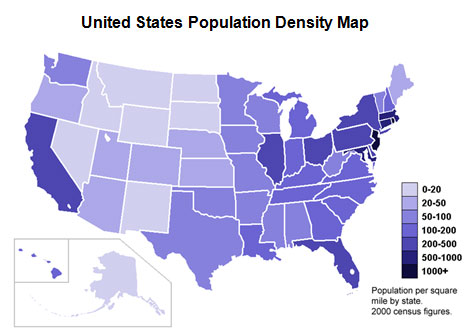
Source: United States Population Density (by state), Wikimedia
Looking at this map, the color scale is used to represent the population density of each state. The lightest blue shades represent states with low population density, while the darkest blue shaded states have high population density.
(Important to note: Looking at California for example, not every city in the state is going to have high population density. California has many large cities, and small towns. This map shows the average throughout the state.)
Population density is important to understand because it helps people in our society make informed decisions about our world. Governments make decisions about funding, constructing new highways, or building schools based upon how many people live in a given area. Businesses also use this information to determine where to locate their businesses and to determine where there customers and employees live.
Check Your Understanding: Answer the following questions to make sure that you understand settlement patterns.
Sources of images used in this section, as they appear top to bottom: