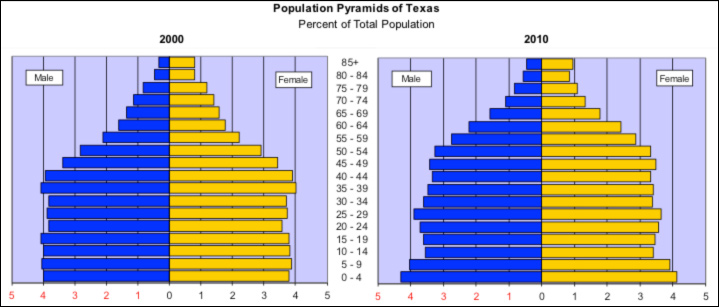
Source: Population Pyramids of Texas, U.S. Census Bureau.
Another way to examine population is by using a population pyramid. A population pyramid is a kind of bar graph. Each horizontal bar shows how many males or females fall into a specific age group. This is called an “age-gender” cohort. The bars are stacked one on top of another in ascending order with the youngest group on the bottom and the oldest on top. A center line divides the graph into a female and male side.
Source: Population Pyramids of Texas, U.S. Census Bureau.
Take a look at the population pyramids of Texas. What is the connection between the age and sex structure of a population? Why does this matter? The age-sex structure determines the potential for growth of specific age groups and the total population. Therefore, an understanding of a population age structure is critical for informed decision-making.
The shape of the pyramid indicates the potential for future growth and can also provide hints about past trends.
Interactive popup. Assistance may be required.
for a couple of hints to help you analyze a population pyramid.
Helpful Hints: A top-heavy pyramid suggests negative population growth that might be because of any number of factors, including high death rates, low birthrates, and increased immigration. A bottom-heavy pyramid suggests high birth rates, falling or stable death rates, and the potential for rapid population growth.
Reading a population pyramid can be difficult, but click different areas on the pyramid below to learn the important parts of a population pyramid.

Now that you know what a population pyramid is and how it works, let’s look at what a population pyramid can tell us. (Click the correct letter to check your answer)
Interactive popup. Assistance may be required.
The largest age group of females in the United States is 45-50.
Correct! There are about 12 million females aged 40-45 based on the population pyramid.
Interactive popup. Assistance may be required.
This pyramid is top-heavy, indicating a negative population growth.
Incorrect. The opposite is true for this pyramid. It is bottom-heavy which indicates that there is rapid population growth.
Interactive popup. Assistance may be required.
There are more older males than younger males in the United States.
Incorrect. The opposite is true. There are more younger males than older males based on this pyramid.