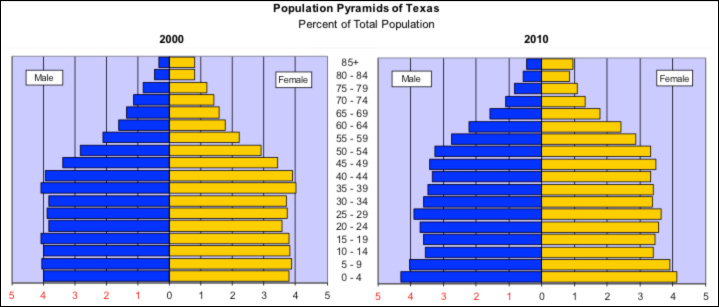
Source: Population pyramids of Texas, U.S. Census.
Now that you are familiar with the stages of population growth (demographic transition models) and reading population pyramids, you will now get the opportunity to apply your knowledge and analyze population growth in Texas.
Source: Population pyramids of Texas, U.S. Census.
Answer the following questions based on the population pyramids above.

Take another look at the pyramids, what stage population growth do you think Texas has experienced from 2000 to 2010? A reminder of the stages of population growth is below.
Stages of Population Growth |
Description of Stage |
Stage 1- No Population Growth |
High Birth Rate and High Death Rate |
Stage 2- Rapid Growth |
High Birth Rate and Decreased Death Rate |
Stage 3- Slow Growth |
Low Birth Rate and Low Death Rate |
Stage 4- Negative or Stagnant Population |
Birth Rate Decreases and Death Rate Decreases |
Stage 5- Sub- Replacement Fertility |
Death Rates are higher than Birth Rates |
Based upon your comparison and analysis of population pyramids of the State of Texas from 2000 to 2010, which stage of population growth has Texas experienced?
Click on the correct blank to check you answer.
Interactive popup. Assistance may be required. A. Stage 1
Incorrect. Stage 1 is no population growth. There is evidence that Texas is experiencing a high birth rate, but a low birth rate.
Interactive popup. Assistance may be required.
B. Stage 2
Correct! Texas has experienced rapid population growth during this time period. There is a high birth rate and decreased death rate.
Interactive popup. Assistance may be required.
C. Stage 3
Incorrect. Stage 3 is Slow Growth. There is evidence that the birth rate is high and the death rate is low.
Interactive popup. Assistance may be required.
D. Stage 4
Incorrect. Stage 4 is negative or stagnant population growth. In Texas, there is evidence that the state is experiencing higher birth rates, but a lower death rate.