 Watch the following presentation about reading population pyramids. Pay special attention to the population pyramids representing China’s population.
The information provided in demographic transition models and population pyramids can also be used to make predictions about population growth.
Watch the following presentation about reading population pyramids. Pay special attention to the population pyramids representing China’s population.
Video: Population pyramids, FiriusRinav, YouTube
In the presentation, you were able to see the changes in population in China into the future. How is that possible? How can researchers determine how population can change 20 or 30 years from now? Easy! By examining the previous and existing pyramids, researchers can detect trends or patterns in population growth.
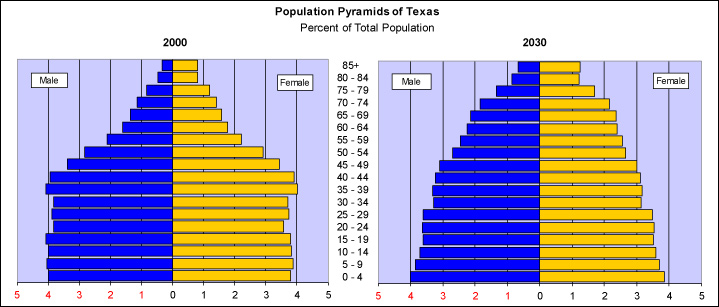
Source: Population Pyramids of Texas 2000 and 2030, U.S. Census.
The pyramids above examine population in the year 2000 and 2030, but wait, 2030 hasn’t even gotten here! Why would this type of pyramid be important? Why would we need this information and how would we use it?
Examine the two pyramids closely and answer the following question in your notes.