It is your turn to make your own population pyramid. You will be given statistics for two regions and provided with steps to creating a population pyramid.
Click here to download the population pyramid template. Use this template to create your own pyramid based on the statistics from the tables below.
Step 1: Write the title of your Population Pyramid at the top
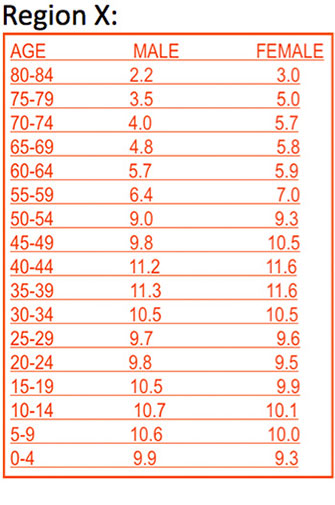
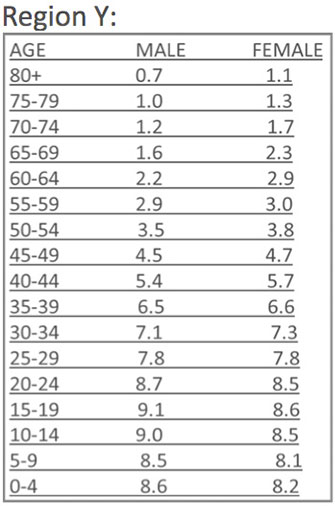
Step 2: Read the table and determine the percentage of population for each gender and age group
Step 3: Fill in the bars for males, then for females
Step 4: Use BLUE for Males/Use RED for Females
Hint: start from the bottom up- it makes it easier!
|
|
When you have finished constructing your population pyramids, click on pyramid names below to see how you did.
Interactive popup. Assistance may be required. Pyramid X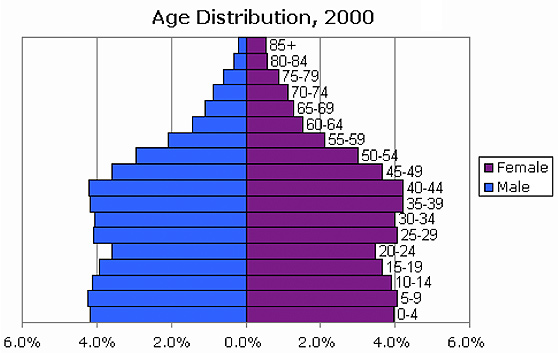
 Interactive popup. Assistance may be required.
Pyramid Y
Interactive popup. Assistance may be required.
Pyramid Y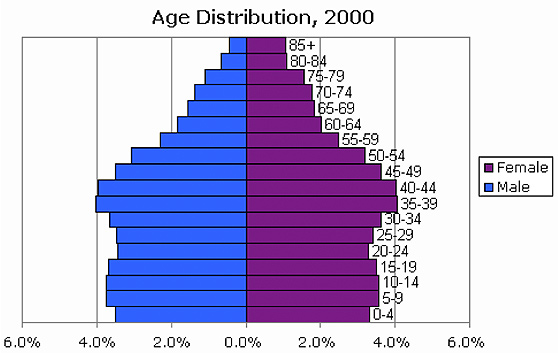
Sources of images used for this section as they appear, top to bottom: