 Take a look at the two pyramids below and answer the questions that follow.
Congratulations! You have learned how to create a population pyramid. In this section, you will examine your pyramids and interpret their meaning. Population pyramids contain a lot of information; there is information about specific genders and age groups.
Take a look at the two pyramids below and answer the questions that follow.
Now it's your turn. Interpret the pyramid for Region Y. Answer the questions in your notes.
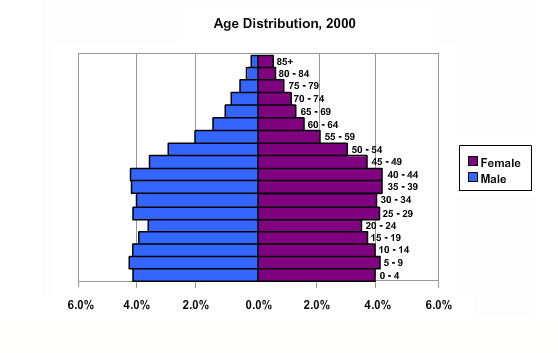
Source: Age Distribution, 2000 population pyramid, CensusScope