Source: Number of Employees per 1000 persons for manufacturing, 2000, U.S. Census Bureau
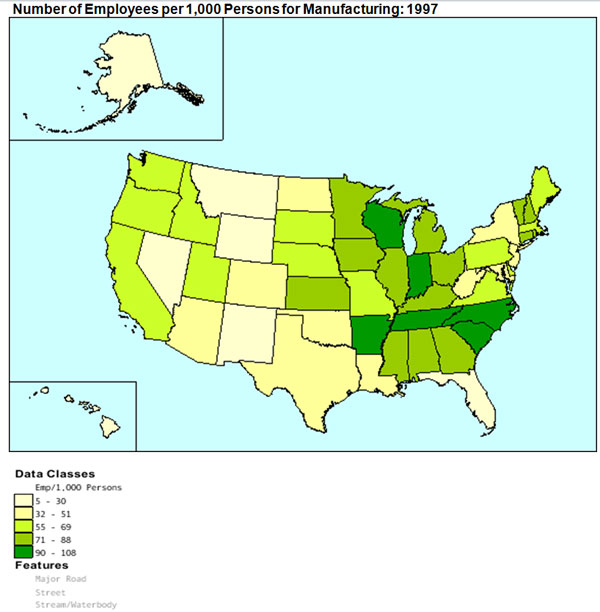
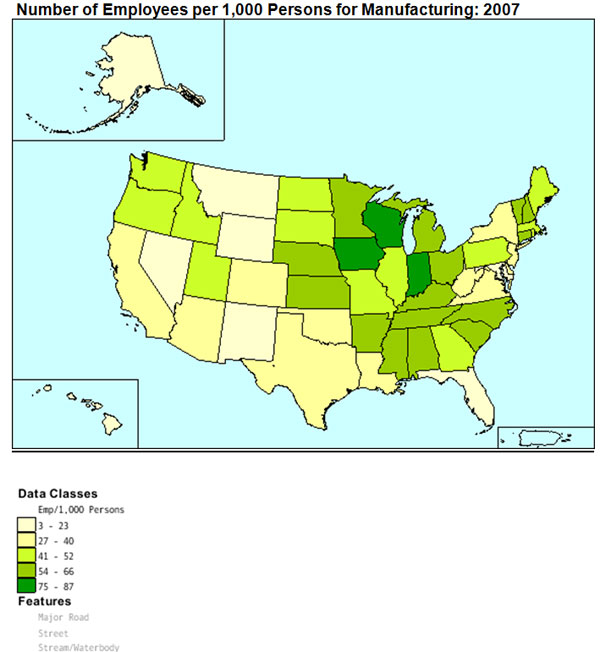
Over time changes will occur within the various economic activities. The following maps, provided by the U.S. Census, demonstrate such a change. Each map represents the number of people employed in the manufacturing industry (secondary economic activity) in the United States in 1997 and 2007. Study each map and determine the differences and similarities within the 10-year span. Use the information that you have learned to answer the questions that follow.
Source: Number of Employees per 1000 persons for manufacturing, 2000, U.S. Census Bureau
Source: Number of Employees per 1000 persons for manufacturing, 2000, U.S. Census Bureau

Other interesting facts about changes in the four economic activities:
Record the answer to this question in your notes:
3. In comparing both maps, many manufacturing jobs were lost within the ten year span. List three reasons why this occurred; provide explanations for your answers. Summarize the impact that these changes had on the Secondary Economic Activity of the U.S. economy during this time span.