Money Flow - Part 2
Statistics & Risk Management
Money Flow - Part 2
Statistics & Risk Management
The income statement provides a financial summary of the firm's revenue and expense activities and net income (or loss) during a specified period, usually one year. It measures recorded fund flows over a given period of time. A closing date of December 31st is used if the firm is on a calendar year; a fiscal year ending on a different date can be used. Monthly statements can be assembled for management; quarterly and annual statements must be made available to stockholders.
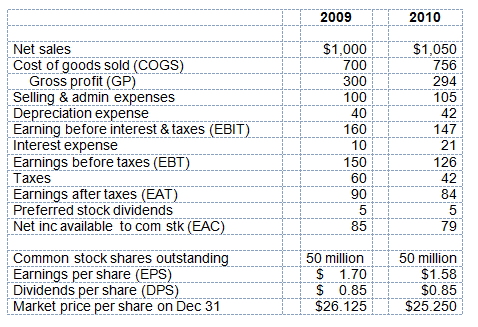
Table 2 -1 presents the income statements for a hypothetical firm, the Zeos Corporation ending December 31 for 2009 and 2010. Two annual statements are presented so as to allow easier operating comparisons over time. A more in-depth analysis would require at least five years of back-to-back statements. The numbers presented are in millions of dollars.
Table 2-1 Zeos Corporation: Income Statements for years ending December 31, 2009 and 2010
Comments on the income statement
The statement begins with sales revenue incurred for the year net of returns and discounts. Cost of goods sold (COGS) representing items moved from inventory and sold is then deducted leaving gross profit (GP). Gross profit is important to management since it shows the immediate profit margin left after paying for finished goods. Next, general selling and administrative expenses are deducted. These expenses are considered overhead and unlike cost of goods sold which varies directly with sales, are mostly fixed in nature.
The next deduction is depreciation expense for the year. As will be explained later, depreciation is a non-cash expense and has an important impact on the flow of cash through the firm for the year. This deduction results in what is termed Earnings before Interest & taxes (i.e., operating profit or EBIT) and represents the firm's "raw" earning power in that it reflects only those expenses necessary to carry out direct operations. Any financing expenses (e.g., interest and preferred stock dividends) are excluded from the calculation of EBIT. Interest expense is the next deduction and reflects the firm's annual coupon payment to the owners of its long-term bonds. These bondholders are creditors to, not owners of, the firm.
Earnings before taxes (EBT) follows and is the amount upon which taxes are levied (in this case taxes equal 40% of EBT) and is assumed to equal the firm's marginal tax rate. Earnings after tax (EAT) follows. From this amount preferred stock dividends are subtracted. These dividends are not considered an expense but appear on the income statement since common stockholders are responsible for dividend payments to their preferred shareholders. This implicit responsibility of the common shareholders means that preferred stockholders can easily be looked upon as debtors to the firm.
Legally however preferred shares are consider equity unless the firm enters some type of restructuring or bankruptcy procedure in which case the court typical treats them as formal debtors. Also, the deduction of preferred dividends from EAT reflects the fact that the intent of the income statement is to show what the owners of the business (the common stockholders) earned in book profit for the year after all monetary obligations have been accounted for. This amount is referred to as Net income available to common stockholders (or Earnings available to common stockholders—EAC).
The next collection of numbers is not directly related to the firm's yearly revenues and expenses and their presentation depends on the firm's reporting method. We see the firm had 50 million shares of common stock outstanding at year's end, 2009. If the company's shares are widely traded among the investing public we can assume its shares are listed on one of the major exchanges or are traded in the over-the-counter market via NASDAQ. Earnings per share (EPS) of $1.70 is obtained by dividing EAC by 50 million shares ($85 million/50 million). EPS is an important metric for shareholders since it gives a per capita measure of annual book profitability on the book value of the equity investment. This ratio is also important to the firm's creditors and other potential investors and is frequently quoted in the financial press and compared to analysts' annual EPS forecasts for the firm.
Dividends, stated on a per share basis (DPS), are determined by the firm's Board of Directors and would be related to the firm's particular dividend policy (a topic to be discussed subsequently). We see that Zeos ended the year with a market-determined stock price of $26.125 per share. This is the only market-based account appearing on the income statement and shows what investors think the stock is worth as it trades in the secondary market. Stock price is forward-looking and gives important clues about what the knowledgeable investors think about management's decision making and the firm's prospects for future earnings potential.
Two related ratios can be of importance to both management and stockholders. They are Zeos' payout ratio and its retention ratio. The former ratio answers the question, "What percent of earnings per share did the firm pay out in dividends?"; the latter ratio answers the question, "What percent of earnings per share did the firm put back into the business?"
For 2009 the payout ratio for Zeos was DPS/EPS = $0.85/$1.70 = 50%; the retention ratio was (1.00 – payout ratio) = (1.00 – 0.50) = 50%. (The fact that the two ratios are equal is coincidental). The payout ratio is the portion of EPS that management decides to return to common shareholders in the form of cash dividends; the retention ratio is the remaining percent of the EPS pie that management decides to reinvest into the firm's assets. This latter ratio is important because it indicates how much of current earnings is "saved" and ploughed back into the firm's asset base. Firms with high retention ratios have strong expectations for future growth and are building core earning assets to support this growth expectation.
The payout/retention breakdown can also impact the firm's stockholder clientele. Those stockholders wishing for higher cash flow today would probably choose firms with high payout ratios, whereas those clientele interested in long-term growth and strong capital appreciation of its stock would choose firms with a high retention rate. So the firm's dividend policy can attract different types of investors.
The revenue and expense numbers and related EPS and DPS numbers for 2010 are interpreted in the same manner. We will make additional comparisons of these income statements that help management monitor money flows and financial status in what follows.
A note on depreciation and depreciation expense:
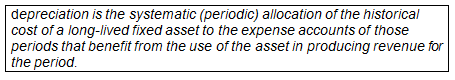
In a related sense, depreciable value is the amount of the asset's acquisition cost to be allocated as depreciation over the total useful life of the asset (net of salvage value).
Note that depreciation refers to physical assets while the term amortization refers to intangible assets like patents. In terms of record keeping they are similar. Both refer to the periodic allocation of a historical cost to a specific period. Our emphasis in this Lesson Plan is depreciation of physical assets.
Since assets are not "used up" in the period they are purchased, it is necessary to "expense" them over time as they produce sales revenue. Otherwise net income would be overstated. As you can see the allocation of depreciation follows logically from the matching principle. Depreciation expense shows up on the income statement since this statement matches revenues with expenses in the period the revenues and expenses were incurred.
Some related comments are in order:
1. Depreciation expense is not an explicit recognition of the physical wearing out of an asset. Rather, it is an allocation mechanism used in pro-rating the cost of an asset over its useful life.This pro-rating exercise is reflected in an account called depreciation expense. If we cumulate this expense we get the balance sheet entry accumulated depreciation which is termed a contra-account in that it reduces the historical book value of the asset over time.
2. There are many types of depreciation allocation mechanisms. Perhaps the most familiar is straight-line depreciation (SL). This method reduces the book value of an asset each year based upon the estimated useful life of the asset (net of salvage value). As a result an equal percentage expense (= 1/n) is written off against the asset per year, where n = the asset's expected useful life.The Modified Accelerated Cost Recovery System (MACRS) is another popular depreciation method allowed by the Internal Revenue Service. The method has strict IRS-prescribed requirements about what percent of the asset can be attributed to depreciation expense each year and what the appropriate property class of the asset will be. The beneficial feature of the MACRS method is that it accelerates the total depreciable cost of an asset (equal to its historical cost) to the front of the asset's life. Clearly the MACRS method will not reflect an equal "wearing out" of an asset and will produce a difference depreciation expense pattern than that computed using the straight-line method. See the Appendix 1 for a listing of MACRS depreciation property classes and related per year depreciation percentages.
3. Depreciation is a non-cash expense. This fact means depreciation cash flow implications since the expense is tax-deductible and creates a tax shelter for the firm. That is the firm uses the expense to reduce taxable income (EBT) thereby lowering its tax liability. This is, no different than the tax treatment of other legitimate tax-deductible expenses (e.g., wages, supply purchases, advertising, utilities, etc.). However, unlike other explicit cash expenses, depreciation, a non-cash expense, allows the firm to keep more of the cash that it earns over the period. If you wish to know the tax saving produced by depreciation for the year, simply compute (T) x (depreciation expense), where T = the firm's marginal tax rate. Since MACRS places a greater portion of the total depreciable value of an asset to the front of the asset's depreciation time line, it produces a greater up-front cash flow "saving" relative to the straight-line method. Hence firm's tend to prefer the MACRS method to the straight-line method for tax reporting purposes. However, for stockholder reporting the straight-line method is usually used since it gives a more realistic picture of the matching process used in financial reporting.
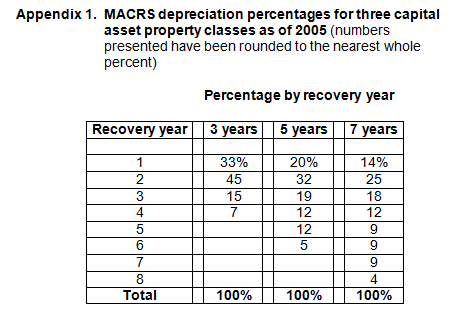
Example: To emphasize the cash flow implications of straight-line versus MACRS methods an example follows.We assume the asset has an economic life of six years and fits into the IRS-determined 5-year class life category for MACRS purposes. This will determine the appropriate per year MACRS percentages. The asset has no salvage value and has a depreciable base of $100. The marginal tax rate is assumed to be T = 40%.
The depreciation schedule which lists the depreciation amounts for each year of the asset's depreciable life follows for both straight-line (SL) and MACRS methods:
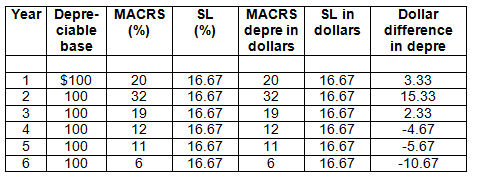
Per year straight-line expense = (1/n) = (1/6) = 16.67% and is constant throughout the asset's life (column 4). The MACRS per year percentages are given in column 3 and follow the required IRS guidelines for a 5-year class life asset (the class life extends the depreciation time line by one year). The dollar difference in per year depreciation expense between SL and MACRS are given in the last column. Notice how MACRS dollar depreciation is greater than SL for years 1 – 3 followed by years 4 – 6 where SL is greater than MACRS dollar depreciation.
You might ask where's the net cash flow benefit to MACRS? While MACRS does provide a greater tax-write off relative to SL in years1 – 3, it also produces a smaller tax write-off relative to SL in years 4 – 6.
This initial conclusion is verified in the next table.
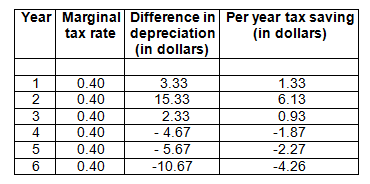
Column 4 of the table shows the per-year tax saving by comparing cash flows using MACRS relative to SL. For example in year 1 the tax saving = .40 x ($20.00 – $16.67) = .40 x ($3.33) = $1.33. In year 2 the saving rises to $6.13 due to the acceleration feature. But note that after year 3 the tax saving turns negative indicating that SL is now providing a larger tax shelter than MACRS. Note also that if you add the dollar amounts in column 4 you get $0 except for rounding error (either method will ultimately write off 100% of the asset). Thus it appears that MACRS is just a "wash" and its use over SL cannot be justified from a cash flow standpoint. But wait one minute . . .
Time value of money considerations would argue against such a conclusion. Specifically if money (cash) has time value, MACRS will prove superior to SL in producing wealth for the firm. In particular the compounding effect of the first three year's of positive MACRS tax shelter savings will outweigh the negative effects of the last three years.
Time value of money effects can best be demonstrated with an example. Assume this firm can invest its cash at 15 percent per year. What is the future value of these positive and negative tax savings at the end of the asset's life in year 6? The answer is:
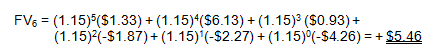
The positive $5.46 indicates that MACRS is superior to SL in producing future value. This reflects the time value of money and is the reason firms usually choose to compute taxes using MACRS instead of SL depreciation.
Content ©2012. All Rights Reserved.
Date last modified: September 18, 2012.
Created with SoftChalk
mobile page
![]()