
Software Proficiency
Statistics & Risk Management
Software Proficiency
Statistics & Risk Management
First things first, let's get Excel started and make sure we are all on the same page. For the advanced Excel users out there, humor us for a minute.
To open Excel in Windows go Start – Programs – Microsoft Office – Excel
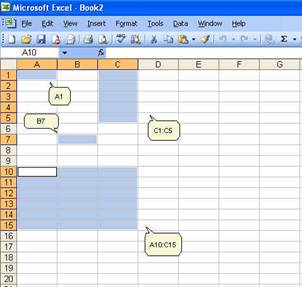
When it opens you will see a blank worksheet that consists of alphabetically titled columns and numbered rows. Each cell is referenced by its coordinates of columns and rows, for example A1 is the cell located in column A and row 1; B7 is the cell in column B and row 7. You can reference a range of cells, for example C1:C5 are cells in columns C and rows 1 to 5. You can also reference a matrix, A10:C15, are cells in columns A, B and C and rows 10 to 15.
Excel has 256 columns and 65,536 rows.
You now have Excel opened up, and I am sure you understand how to use it, so let's get into using Excel to answer questions about our data. For this module we will be using the Data Analysis ToolPak. So the first step is to make sure it is installed in your Excel program.
To check within Excel 2003, go to Tools – Data Analysis. If you do not see "data analysis" option then you need to follow these instructions to install it:
http://office.microsoft.com/en-us/excel/HP011277241033.aspx
To check within Excel 2007, go to the Data tab. If you do not see 'Data Analysis' in the analysis block, then you will need to follow these instructions to install it:
http://office.microsoft.com/en-us/excel/HP100215691033.aspx
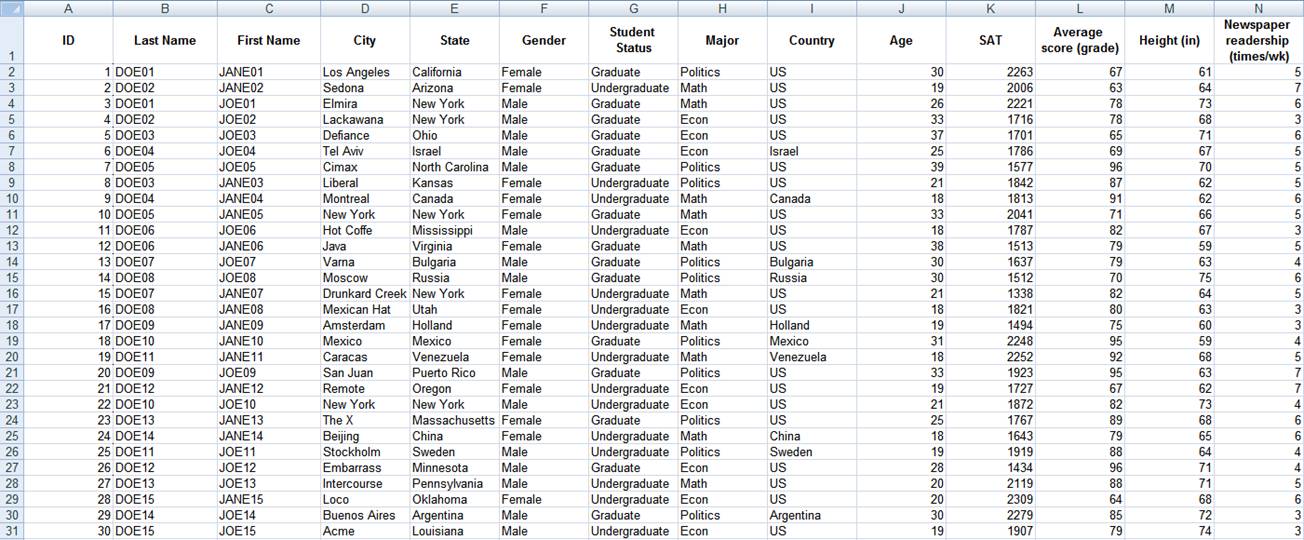
Once it is installed, we will be using the following practice data to explore the analysis options.
The practice data include observations made on a random sample of 30 university students. Variables included are their home cities and states, gender, major, age, height, SAT, GPA, and the number of times per week they read newspapers.
To follow along on your own Excel program, download the following file.
After looking at this practice data, you may have the following questions:
How many males/females?
What is the average age?
How many undergraduate/graduates students?
What is the average SAT score? It is the same for graduates and undergraduates?
Who reads the newspaper more frequently: men or women?
You can start answering some of these questions by looking directly at the table, for some other questions you may have to do some calculations by obtaining a set of descriptive statistics. This round of analyses will give us measures of central tendency as well as measures of variability. So how do we do it?
First go to the location (for your version of Excel) where the Data Analysis ToolPak is located and select it. You should see the following window pop up. It may look slightly different depending on your version of Excel.
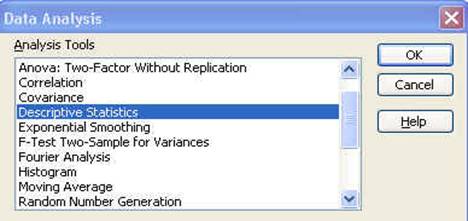
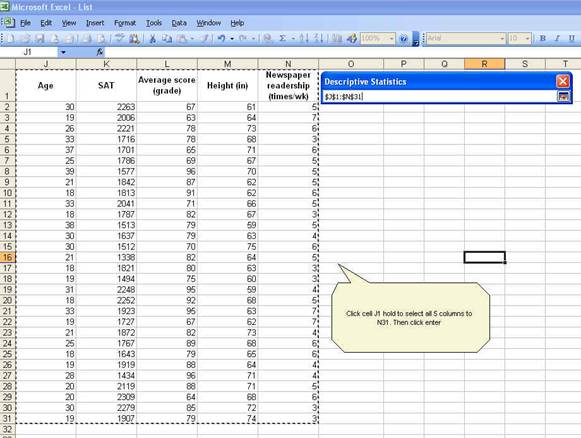
In this window, select 'Descriptive Statistics' by double clicking, or select it and click OK. Next you will see the following window appear.
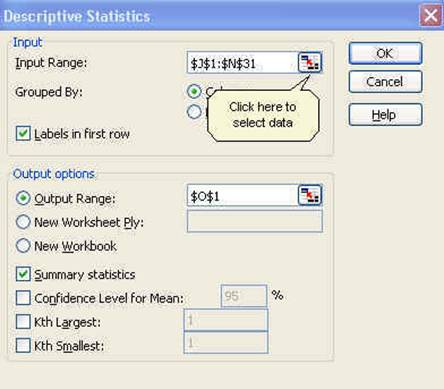
As indicated click on the indicated graphic to input the Input Range for your descriptive analysis. This will allow you to select the values you want (at this point you should have the practice data opened in your Excel). You are going to select J1 (The age heading) and drag your mouse to N31. (the last value in the 'Newspaper...' column) Press enter.
Since we include the labels in first row make sure to check that option. For the output option which is the place where Excel will enter the results select O1 or you can select a new worksheet or even new workbook.
Check "Summary statistics" and then press OK. You will get the following:
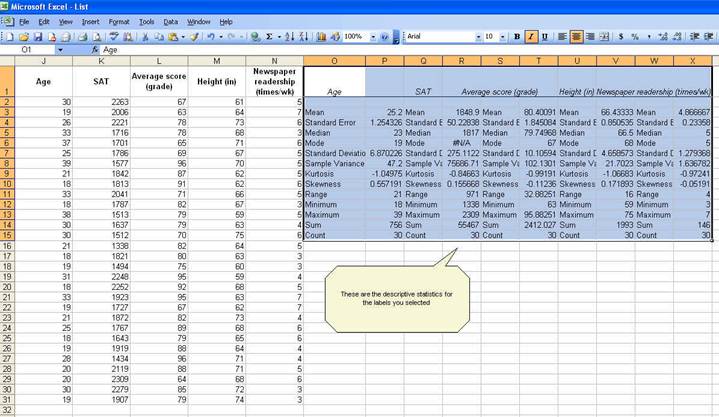
To clean this up a little, let's select all of the output and go to the format cells window. When you get to the format cells window (right click on the highlighted section) select number and format everything to one decimal point. Note: you will likely need to expand each column to see all the details in the columns.
Now we know something about our data.
The average student in this sample is 25.2 years, has an SAT score of 1848.9, got a grade of 80.4, is 66.4 inches tall and reads the newspaper 4.9 times a week. We know this by looking at the mean value on each variable. If you look at the last two rows: "sum" and "count" you can estimate the mean dividing "sum" by "count". You can also calculate the mean using the formula within Excel. To access a formula within Excel, start a cell with '='. This will give you access to the function toolbar. Select the desired analysis from the pull down menu. Once you are familiar with the analysis abbreviations, you can just type the command into the cell, starting with '=' without going through the pull down menu.
=AVERAGE(range of cells with the values of interest)
For "age"
=AVERAGE(J2:J31)
Other common commands:
Sum = SUM(range of cells with the values of interest)
Count = COUNT(range of cells with the values of interest)
Standard Deviation = STDEV(range of cells with the values of interest)
Median = MEDIAN(range of cells with the values of interest)
Mode = MODE(range of cells with the values of interest)
Skewness = SKEW(range of cells with the values of interest)
Created with SoftChalk
mobile page
![]()