The Dividends-Today-vs-Growth-Tomorrow Tradeoff
A distribution plan chosen by the firm today determines its expected future capital growth tomorrow. When a firm pays a cash dividend it is sacrificing cash resources that could be plowed back into positive NPV projects so as to provide for long-term capital growth. Hence the dividend policy reflects a tradeoff: For firms with a rich menu of positive NPV projects, a high dividend payout comes at the expense of a lower expected rate of long-term capital appreciation in the firm's stock.This appreciation of the stock is due to the longer-run expectation that investment expenditures made today will result in added profitability at some point in the future. It is this expected profitability which will be reflected in long-term appreciation of the stock price.
The tradeoff is demonstrated graphically in Figure 5-1 below.
Note the following with respect to the graphic. While cash can be used to pay interest, repay debt principal, repurchase stock, buy short term investments, or simply sit idle, here we assume that cash (today) can be used for only two things:
(1) to pay dividends, or
(2) to plow back the cash into more (positive NPV) investments.
The term dividend payout ratio is usually applied to income statement earnings. Here we define a cash payout ratio as the proportion of cash paid out as a percent of total cash reserves.
Figure 5-1
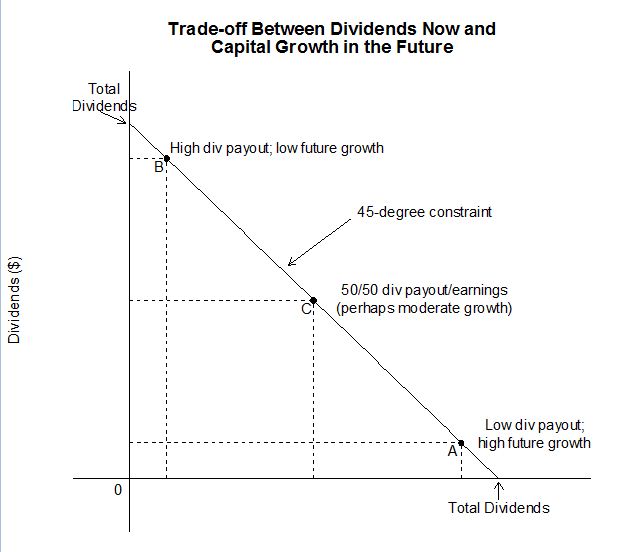
In this graph the 45° line shows the budget constraint faced by the firm (today). The horizontal and vertical intercepts indicate the total cash reserve paid out as dividends. Notice the slope of the tradeoff function is negative and offers a menu of payout versus capital appreciation possibilities. For example, if the firm chooses to be at point B it will have a high cash dividend payout ratio and a low expected growth rate in the future; if the firm chooses to be at point A it will follow a low cash dividend payout today and thus be able to plow back cash into new investments. This will result in a higher expectation of long-term capital appreciation of the firms stock in the future. Point C is a middle-of-the-road choice where both current payout and plow-back take an equal part of the firms cash reserves.
Keep in mind that the 45° line can move out to the right over time as the firm's cash base grows. In this longer-run case the firm could have more of both—a higher payout and a higher amount applied to capital expenditures. In order to emphasize the tradeoff, and since dividends or investment expenditures are assumed to require cash today, we hold the constraint constant.
The industry and the technology influence: While the firm faces this "dividends today versus growth tomorrow" constraint, the more interesting question is why a particular firm would choose to be at point A, B, C or some other point on the constraint in Figure 5-1 (including the vertical and horizontal intercepts where we have either a zero payout or 100 percent payout).
As you can easily understand the answer turns on the ability of the firm to find and invest in good capital projects. This ability depends, to a large extent, on the type of industry in which the firm resides and the technological opportunities offered by the industry. We should expect to find high-tech growth industries, ones where technological advances are taking place and that are producing a rich list of profitable investment choices, having lower payouts and higher retention rates than firms located in mature stable industries.
This result is demonstrated empirically in Figure 5-2 which replicates data from a Value Line report written in 2002. The upper part of the figure shows that companies that pay high dividends (and have low retention rates) are in slow-growth and low technology industries. These industries are usually mature and simply don't offer a rich menu of new ideas for companies to invest in. As a result they tend to pay high dividends. Conversely the lower part of the figure lists companies that are in newer and more technologically advanced lines of business. There we see that these companies are choosing to take advantage of technologically-produced high expected NPV projects. As a result they limit or exclude dividends completely.
This latter option would be located at the horizontal intercept in Figure 5-1.
Figure 5-2
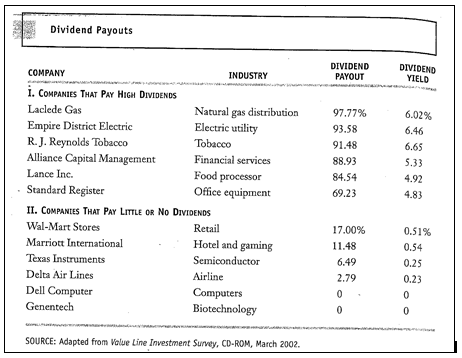
The dividend yield shown in the figure is computed by taking the average share price for the year 2002 and dividing it into the firm's annual dollar dividend. The payout ratio is computed by dividing total dividends for the year by the firm's annual earnings available to common shareholders. If you subtract this percentage from 1.00 you get the firm's 2002 retention ratio described in Part 2 of the Money Flow lesson. For example the retention ratio for Texas Instruments in 2002 was about 94% (= 1.00 - .0649).
Notice the substantially different payout ratios of these two groups of companies. You should be able to see that the firms in the low payout category are in stable, mature industries. These firms don't typically have a large menu of high NPV projects facing them. As a result, they don't engage in massive capital expenditures and their cash flow can be devoted to dividends. They will attract a dividend-conscious clientele. Conversely, the firms making up the lower category are in "growth" industries; these firms will have a large amount of good projects to undertake. As a result they will tend to preserve cash by paying little or no dividends. As a result, they will attract a clientele interested in long-term capital appreciation of the stock.
Instructor side-bar: Frankly, I'm surprised to see Wal-Mart's payout ratio so high at 17% of earnings for year 2002—during the 1980s it was 0% as they undertook a massive expansion campaign. While they are still growing today, the rate of growth has slowed. Additionally Wal-Mart is a "cash cow"—they have sufficient free cash flow to pay dividends and engage in growth at the same time. Not many firms can do this. Ya gotta love Wal-Mart !