Two Short-Term Financial Planning Methods
The Additional funds needed forecast (AFN) constitutes the end-product of the short-term financial operating forecasting exercise. At this stage we are not concerned how the funds needed will be raised (i.e., debt or equity). Rather our concern here can be stated as a simple question:
"What additional funds will be needed (AFN) from external sources so that the firm's sales forecast can be achieved after allowing for funds generated internally?"
Numerous techniques can provide this forecast. We will concentrate our discussion on three such methods:
1. the Additional Funds Need formula
2. the pro forma Percent-of-Sales method
3. the monthly forecasted cash budget. A review of Part 4 on financial ratios will be helpful before beginning this section.
Other assumptions: Our forecasting horizon will be one-year for numbers (1) and (2) above; this will keep things simple and still reveal the basic principles involved in the financial planning task. Longer horizons can be easily formulated using electronic spreadsheets. We will also assume our hypothetical firm is operating at capacity—if sales are going to increase, more core operating assets will be required. We will assume the firm's financial ratios are at some normal or equilibrium level and are expected to remain the same after the needed funds are obtained and used to purchase core assets.
The Additional Funds Needed (AFN) formula
The AFN method is defined with the following formula:
Eqn 1: AFN = (A*/S0)∆S – (L*/S0)∆S – NPM(S1)(b) ,
The terms in Eqn 1 are defined as follows:
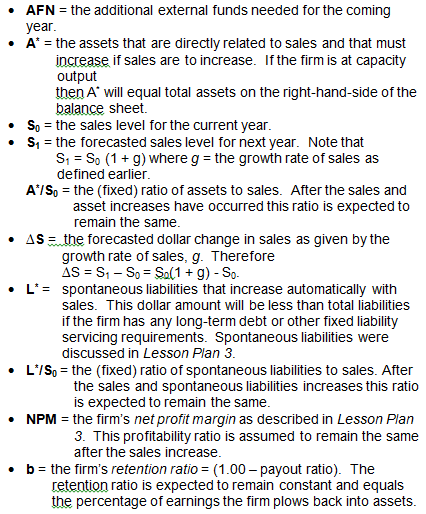
Summary: The AFN formula is intuitive. It is intuitive in the sense that it forces a direct correlation between sales growth and the amount of assets that will be required to accommodate that growth. For firms that are at capacity output and are not in the midst of major structural alterations to assets and liabilities, the assumption of constant (A*/S0) and (L*/S0) ratios is acceptable. For firms experiencing stable growth the assumption of a constant NPM and retention ratio is acceptable. Notice also that the first term in Eqn 1 represents a "use of funds" triggered by an increase in sales. The second term represents a "source of funds" triggered by the same increase in sales. Finally the, third term represents funds generated internally (i.e., retained earnings). An algebraic summation of these three terms provides the additional funds that must be raised externally.
The AFN formula is also a bit simplistic. This fact should be taken into account by management. Its intent is only to provide a rough short-run idea of what additional financial resources will be required for a projected increase in sales. If the assumptions cited above about the assets needed per dollar of sales or the spontaneous liabilities created per dollar of sales are not likely to be met then the formula will perform poorly. Management should also take account of any economies of scale effects that might come about due to the addition of core assets. This phenomenon would serve to alter the assumed constant (A*/S0) ratio.
A problem using the AFN formula: This problem will use the balance sheet numbers for the Zeos Corp. seen in Part 2. From the balance sheet for year 2010 we see total assets equal $470 million. Spontaneous liabilities equals $58.5 million and is the sum of accounts payable, notes payable, and accrued expenses. We exclude currently maturing long-term debt since it is independent of sales. Sales for 2010 was $1,050 in millions of dollars.
Thus the (A*/S0) ratio for Zeos Corp. = $470/$1,050 = 0.45 or 45%. This means that assets must increase by $0.45 per dollar increase in sales. The spontaneous liabilities ratio for Zeos is (L*/S0) = $58.5/$1,050 = 0.055 or 5.5%. This means that every dollar of sales generates about $0.055 in spontaneous funds. The net profit margin for Zeos for 2010 = $79/$1,050 = 0.075 or about $0.075 cents per sales dollar. Finally in 2010 Zeos retained (1.00 – payout ratio) = (1.00 – DPS/EPS) = [1.00 – ($0.85/$1.58)] = b = 0.462 or about 46.2 percent of earnings.
Question: If Zeos forecasts a 10 percent increase in sales for 2011, what will be the additional (external) funds that will be needed (AFN)?
Answer: Note that a 10 percent increase in sales gives
∆S = S0(1 + .10) – S0 = 1050(1.10) – 1050 = 105.
The sales level expected in 2011 is 1050(1.10) = $1,155 million.
Plugging the numbers into the formula given by Eqn 1 we have:
AFN = (A*/S0)∆S – (L*/S0)∆S – NPM(S1)(b)
= (0.45)105 - (0.055)105 – (0.075)(1155)(0.462)
= $1.45
Summary Given the fixed ratios, the profit margin, and retention ratio, Zeos should plan on acquiring about $1.45 million dollars in (new) external funding order to support the 2011 projected sales increase of 10%. Notice that internally generated funds ($40.02 million) will not be sufficient to fully cover the funds needed.
While improbable, a firm's particular AFN formula could produce a negative AFN. This could result if the internal productivity of the firm in generating earnings combined with its payables policy outweighed the technological need for more assets. In this case the firm might use the funds to reduce debt or retire stock or simply let it sit idle.
The pro forma Percent-of-Sales method:
The second method of forecasting the additional (external) funds needed uses the sales forecast for the coming year and the so-called Percent-of-Sales method to generate the pro forma income statement and balance sheet for the coming year. In this context the term pro forma means forecast. Basically, what the Percent-of-Sales method does is hold the accounting structure of the income statement and balance sheet constant and via a sales increase force this increase through these statements so as to produce the AFN.
Here are some important definitions that we will later demonstrate numerically:
- Percent-of-sales method—A forecasting method that forecasts sales and then expresses the various income
statement and balance sheet items as percentages of forecasted sales.
- Pro-forma income statement—A forecasted income statement based upon on a forecasted sales level (for next year).
- Pro-forma balance sheet—A forecasted balance sheet based upon the projected sales and retained earnings increase as computed in the pro forma income statement.
A chief assumption: A chief assumption of the Percent-of-Sales method is that key accounts on the current income statement and balance sheet are driven by sales activity in a linear fashion. The method also assumes a given account will remain the same percent of sales for the forecasted year as it is for the current year. These are reasonable assumptions if the firm is operating at capacity and if the financials are in some kind of normal or equilibrium state. If this is not the case, management must alter the assumptions accordingly. While the method allows management to discretionarily alter key ratios as they see fit for the pro forma statements, a strict application of the method takes each income statement and balance sheet account and expresses it as a fixed sales ratio.
Example: Let's take just a few selected accounts from the Zeos Corporation's financials as shown in the Part 1 to demonstrate how these percentages are constructed:
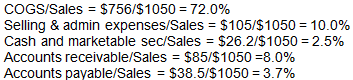
- In 2010 Zeos had Sales of $1,050; COGS = $756; Selling & administrative expenses = $105; Cash and marketable securities = $26.2; Accounts receivable = $85; Accounts payable = $38.5.
Restating these amounts as percentages of sales for 2010 we have:
If these (and other) financial statement accounts can be expected to remain the same for the coming (forecasted) year we can proceed to construct forecasted values for these accounts.
Example: Sales for Zeos for 2010 were $1,050. Research and analysis leads management to forecast a 10% increase in sales for 2011. The firm is currently operating at capacity. Given the forecasted sales increase, what are the forecasted values for the above accounts for 2011?
Solution: Using our Future Value equation from above we have a projected 2011 sales amount of $1,155 as seen below:
FV2011 = PV2010 (1 + .10)
1155 = 1050 (1.10)
Using the percentages from above, our projected account values for 2011 are accordingly:
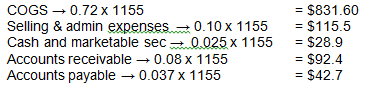
If no sales ratio relationships are changed by management, other accounts can be computed in a similar fashion. This provides the information for a full-blown pro forma income statement and balance sheet.
The steps: The following is a listing of the steps involved in application of the method:
1. Determine the sales forecast for the coming year.
2. Using the sales forecast, construct the pro forma income statement and determine the funds that will be generated internally given this forecast.
3. Construct the pro forma balance sheet.
4. Subtract pro forma total assets from pro forma total liabilities and equity. If the difference is positive additional (external) funds will be needed for the coming year if the sales forecast is to be met. This amount is often referred to as ExternaFunds Required (EFN).
Notice the following important points with respect to the 4th step:
- The amount of new financing that will be required is a plug number necessary to make the pro forma balance sheet balance.
- A positive number for external financing required suggests the firm will have to use either more debt, more equity, or a combination of both in order to support the additional assets that will be required to support the forecasted increase in sales. A positive EFN will typically be the case if the firm is operating at capacity since internally generated funds (i.e., the addition to retained earnings from the pro forma income statement) will usually be less than what is required in total.
- In order to isolate the additional (new) funds that will be required from the total long-term non-spontaneous financing already being used by the firm, the Percent-of-Sales method holds long-term debt, preferred stock, common stock at par, and paid-in capital constant. The only equity account allowed to change is the additional retained earnings amount generated from the pro forma income statement. The purpose of holding these items constant is to allow management to determine in an ex ante fashion how the EFN is going to be raised (e.g., either more debt, more equity, or a combination of both). Since the needed funds are determined prior to raising them via marketing the firm's securities, the method allows management to engage in more accurate financial planning. However, as mentioned above, the pro forma results do not specify how the needed funds will be raised. This is a topic for subsequent management consideration.
A problem: We will continue to use the financials for the Zeos Corp. originally illustrated in Part 3.The specific objective is to determine the EFN for Zeos for 2011 assuming a sales increase of 10% from year 2010.
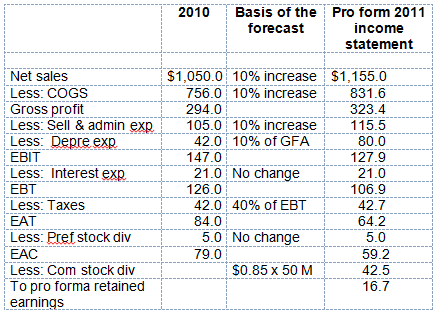
Actual and pro forma income statements: The actual and pro forma income statements appear below in Table 6-1.
Table 6-1 Zeos Corporation: Actual income statement for year ending December 31, 2010 and the pro forma statement for 2011 ending December 31, 2011 (in millions of dollars)
Comments and management assumptions: A few quick comments are in order about the 2011 forecasted income statement. These comments are based upon the Percent-of-Sales method and the need to blend assumptions and management discretion.
A large part of Selling & administrative expense is fixed. However, if the firm is operating at normal capacity, management assumes a 10% increase in this expense is justified. Given the fixed nature of some of the administrative expenses it is quite possible that an amount less than a strict 10% increase will be required. The final amount of the increase would be a decision that management would be required make based upon their knowledge of the business and engineering and capacity constraints. Management has decided to use the 10% increase estimate in selling and administrative expenses as it represents the most that would be required.
The pro forma amount of depreciation expense will depend upon the type and dollar amount of the fixed assets that are added to the firm's operating base. For this example, management assumes that depreciation expense will equal 10 percent of Zeos' 2011 gross plant and equipment. As described in the next section, management forecasts that gross fixed assets for 2011 will be $800. While this is a sizeable 68 percent increase in gross assets from 2010 it is important to realize that management must take a longer-run financial planning perspective than just one year when it comes to adding expensive core earning assets. That's what Zeos' management appears to be doing in the interest of minimizing the long-run cost of adding to its growth asset base. Specifically, while in the long-run there is a relatively close relationship between sales and fixed assets, it is usually cheaper and less cumbersome to add larger amounts of fixed assets at one time than to add smaller "chunks" of these assets incrementally in year-wise fashion. This will initially result in some over-capacity for Zeos in the short-run but will reduce what would be a more expensive and more cumbersome per year sequence of continually adding fixed assets as production needs grow. Zeos, through sales growth, is expected to "grow" into the higher asset base. This logic highlights the applied practice of longer-run financial planning followed by most firms.
At this juncture, it is also instructive to refer back to the Part 2 where we saw the balance sheet, the percentage change balance sheet, and the statement of cash flows all indicating that Zeos was not committing funds to future growth. In 2010 the data indicated that after allowing for depreciation the firm experienced negative fixed asset growth of 15 percent. Perhaps the large $325 million investment in fixed assets planned for 2011 reflects an attempt to correct this problem.
Interest expense does not change on the initial pro forma income statement since management is uncertain at this time where the additional funds needed will come from. If debt is to be used, interest expense will be higher than the 2010 level; if all equity is used there will be no change in the 2011 interest expense relative to 2010; if a mix of new debt and equity is used to fund the new fixed assets some added interest expense will be indicated ex post. Under any scenario management does not believe these possible changes to the 2010 posted interest expense will alter the general conclusions of the analysis. Thus it is appropriate to carry the 2010 amount over to 2011 until the actual financing mix is decided and until the cost of borrowing added funds is determined.
The semi-contractual nature of preferred stock dividends indicates that the pro forma 2011 income statement should keep preferred stock dividends the same. For the common shareholders Zeos has followed a stable common stock dividend policy in the past and wishes to do so in the future. This dividend stability philosophy followed by Zeos' management parallel's our discussion in the 'Probability' module which explained the reasons firms tend to keep dividends reasonably constant over time. Hence they will continue to pay $0.85 x 50 M = $42.5 million in common stock dividends.
The remaining $16.7 million in earnings (not paid out as dividends) will be closed out to the pro forma 2011 balance sheet amount of retained earnings. This amount represents internally-generated funds and will help reduce the amount of externally-generated funds needed (EFN).
As you can see the pro forma income statement is critical to good financial planning. While it is primarily based upon a set sales growth rate assumption, it is also reflective of certain contractual, semi-contractual, and managerial discretionary items. This statement is not etched in stone. Rather, it constitutes a flexible planning device.
Actual and pro forma balance sheets: Zeos' actual and pro forma balance sheets for 2010 and 2011, respectively, appear below in Table 6-2.
Table 6-2 Zeos Corporation: Actual and Pro Forma Balance Sheets for years 2010 and 2011 ending December 31
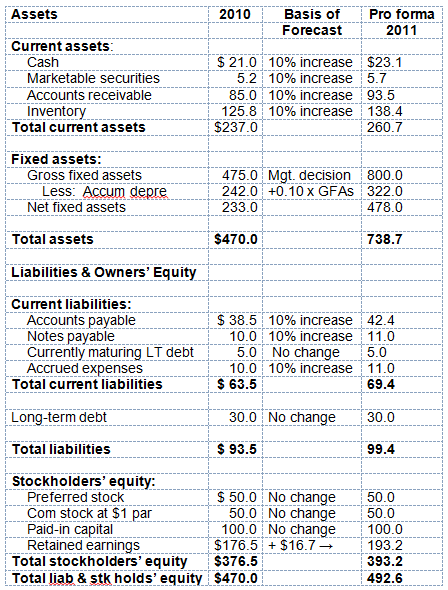
Comments on the pro forma 2011 balance sheet: The forecasted balance sheet shows current assets increasing by 10%, in line with the projected increase in sales. After consulting with an engineering consultant and the production staff, management has concluded a sizeable increase in core fixed assets will be required. After pricing these assets (including installation and set-up) management has determined a $325 million increase (= $800 - $475) in capital spending is appropriate. As mentioned above, this increase will initially result in some over-capacity. However, management feels the over-capacity will not last long and based upon their longer-run strategic financial plan they determine it is cheaper to over-add fixed assets at one time than to do so incrementally. Depreciation is estimated to be 10 percent of gross fixed assets in 2011. This will leave $478.0 in net fixed assets.
Current liabilities will increase by 10% and is in line with the percentage sales increase. Currently maturing debt is a recurring fixed charge and is unrelated to the sales increase. Long-term debt and the equity accounts are carried over from 2010 given that management has not yet decided on how any new funds requirement will be satisfied. However, there will be an addition to equity from 2010 retained earnings amount ($16.7 million) that will be incorporated into the 2011 retained earnings total. This represents internally generated funds and is an important piece of information as management goes through the forecasting exercise.
As you can see the pro forma 2011 balance sheet does not balance; forecasted total assets exceed forecasted total liabilities plus owners' equity. That is we have:
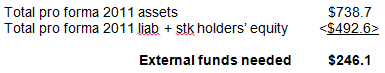
Conclusions and observations on EFN forecast Management now has some idea of the external funding requirement that will be needed to support the projected 10 percent sales increase in 2011. While an approximation, the EFN forecast is an important piece of information, one that is better known now than when the funds are actually needed.
Other uses of the analysis: There are other uses of the EFN forecast for management's financial planning task.The forecast does not indicate how the funds might be raised. Hence such questions come to the fore:
1. Should debt be used? How are the firm's bonds trading and at what price will the firm need to offer to sell additional bonds?
2. Should stock be used? How is the firm's stock trading and what required rate of return does new equity need to offer potential stockholders so as to attract and retain their capital?
3. What would flotation costs amount to with each type of financing?
4. How will the raising of funds impact the firm's target capital structure and the firm's overall total cost of capital?
5. If debt capital is used will the additional debt impact the firm's existing bond covenant restrictions? How might more debt impact Zeos' bond ratings with its credit analysts?
6. If more stock is used how will existing stockholders view the dilution to their ownership?
7. How will the additional funds (however raised) impact the firm's financial ratios and particularly its debt and debt coverage ratios and its profitability ratios? Perhaps some pro forma liquidity, activity, debt/debt coverage, and profitability ratios might be constructed once the method of financing is determined
8. Finally there's the cash flow implications of raising capital and then putting it to work. Management must consider how quickly the raised capital can be expected to start generating cash. A projected statement of cash flows is in order once the method of financing has been determined.
Management should consider the length of the time lag between the expenditure of funds for new investment and when those investments will start to generate cash. This is clearly a solvency issue that should be investigated simultaneously with the financial forecasting phase of the EFN exercise.