Coping with Uncertainty in the Cash Budget
The cash budget is based upon forecasts. Statistically this means that a cash budget represents a collection of expected values. Because actual ex post outcomes can differ from what's expected, they introduce uncertainty into the cash budgeting task.
There are two main methods to deal with cash budgeting uncertainty after the firm has compiled the best forecasts possible:
1. The firm should make certain it can tap short-term financial markets in a timely fashion at reasonable costs. This would include maintaining good relations with banks and other lenders and making sure the firm's credit ratings are solid.
2. Cash budgets should be subject to scenario or what-if analysis. This second method would provide management with some before-the-fact idea of the cash flows that would result if small but possible changes to critical variables occurred.
With electronic spreadsheets (2) can easily be carried out.
Scenario example using Table 6-3A. While many variables could be changed simultaneously in Table 6-3A to produce a scenario, let's keep it simple and assume that monthly sales is the only variable that is altered from its expected monthly values for January through June. This is a reasonable variable to alter since many of the other variables are fixed either by management discretion or by legal contract.
Obviously uncertainty on the downside (i.e., deviations from expected values that produce cash deficits) should perhaps be given greater weight than deviations on the upside (i.e., deviations from expected values that result in cash surpluses). That is downside risk is generally considered more important than upside risk in cash budgeting situations. Given this reality we generate a forecast based upon the following downside assumption:
Assumption: The monthly sales forecasts turns out to be 5 percent lower than forecasted. The results are shown in Table 6-3B.
Table 6-3B: The cash budget for XYZ Industries for Jan – June, 2011 assuming sales are 5 percent lower than forecast
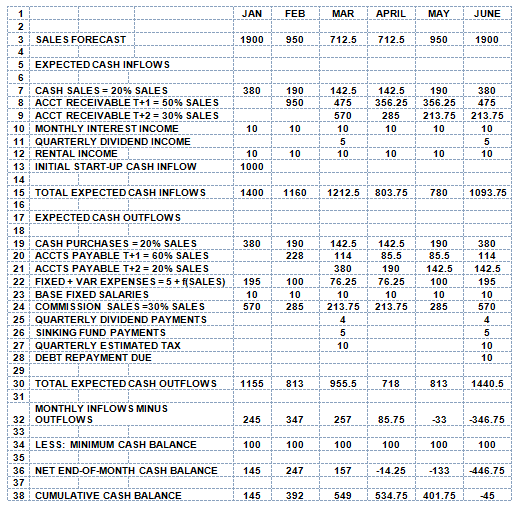
Table 6-3C compares the results taken from the "base case" situation with the 5 percent downside situation.
Table 6-3C A comparison of the base case and the 5% downside cash budget
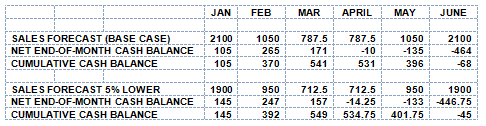
Analysis of the downside results: The results are interesting in that a 5 percent decrease in sales for each month from the base case situation actually increases the cumulative cash balance for each month. The reason for this counter-intuitive outcome is the lagged accounts payable relative to the lagged accounts receivable amounts for each month. Specifically in period t + 1 accounts receivable brings in 50 percent of sales while accounts payable shields 60 percent of XYZ's sales from cash collection. This amount cumulates over time and produces a (algebraically lower) cumulative balance in June. We covered this phenomenon in Part 3, when we discussed the net average daily collection period in days. For XYZ the net ADCP is negative meaning the firm is paying for its working capital with funds provided by its vendors. In this downside scenario this is reflected in expected cash outflows falling less than proportionally to total cash inflows.
Summing up: The point here is not to display what appears to be a perverse result. Rather the point is to show that scenario analysis can provide some before-the-fact perspective so that management can engage in better financial planning when projections are risky.