Confidence Intervals and Single Population means with Z
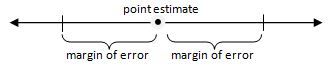
Once you have computed a point estimate, you need a way to describe how far this estimate could be from the actual true population parameter. This leads to the concept of the margin of error. A confidence interval has the form:
![]()
The margin of error provides a statement of how far from the point estimate the actual population parameter might be located:
The margin of error is based on the assumption that if you could obtain many samples from your population, a histogram of those sample point estimates would resemble a Normal bell-shaped graph. The Normal Model has special mathematical properties that we can exploit (including probabilities) in the construction of a confidence interval.
The margin of error is made up of two components: a critical Z score (a value we can look up on a table thanks to the mathematical work done by others!) and the standard deviation of the point estimate. Here we will look specifically at a confidence interval that is called a Z Confidence Interval for a Population Mean. It is actually not used very often in practice because it relies on an assumption that we know more about the population that is realistic to know. But it is useful when learning about the workings of a confidence interval. We will go on to a more common and realistic variation of confidence intervals on the next page of this lesson.
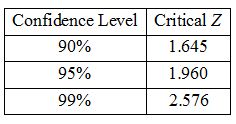
To compute the margin of error, we first need to select a level of confidence. Traditionally, 95% is probably the most commonly used level (although sometimes 90% or 99% will be used). From a table that can be found in the back of most introductory statistics books (or with computer software), we find the critical Z value that corresponds to our level of confidence.
Here are three useful critical Z values:
The margin of error is then computed as:
![]()
where  represents the standard deviation (i.e. variability) of the sample mean if we took many samples and computed the sample means.
To compute 
![]()
where σ is the population standard deviation (the one you really never know - we'll deal with this problem soon), and n is the size of your sample. Note that the larger the sample size n, the smaller the standard deviation  . In other words, the larger the sample size, the less chance for large variability due to an unlucky sample consisting of extreme values.
Once you have the margin of error you can compute the lower and upper limits of the confidence interval:
Lower Limit = point estimate - margin of error
Upper Limit = point estimate + margin of error
For our example of estimating the mean weight of 10-year-old girls, let's suppose we have a sample of 25 weights with a mean of 90 pounds and a standard deviation of 36 pounds. Further, let's assume that the weights of 10-year-old girls are approximately normally distributed (if a histogram of the sample data somewhat resemble a symmetric bell-shape, this is a reasonable assumption) so we can compute a 95% confidence interval to estimate the true mean weight in the population of all 10-year-old girls.
First compute the margin of error:
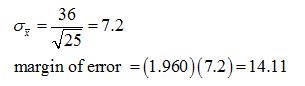
So the limits of the confidence interval are:
Lower Limit = 90 - 14.11 = 75.89
Upper Limit = 90 + 14.11 = 104.11
This means that we can be 95% confident that the true mean weight of the population of 10-year-old girls is somewhere between 75.89 pounds and 104.11 pounds. The 95% confidence means that if we could have obtained 100 different samples of 25 10-year-old girls and computed the means and confidence intervals, we would expect about 95 of those 100 different intervals to successfully have "captured" the truth. Unfortunately, we don't know if our particular sample led to one of the successful intervals or one of the unlucky ones. But the odds are in our favor that we have one of the successful ones!
What if we decided to compute a 99% confidence interval for our sample? The only difference would be the critical Z value. The higher the level of confidence - the larger the critical Z and the wider the confidence interval.
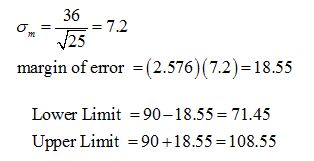
Now we can state an estimate for the mean weight of 10-year-old girls to be between 71.45 pounds and 108.55 pounds. Note the slightly less-precise estimate because of the wider interval associated with higher confidence. We were more sure of having stated an interval that contains the truth, but at the cost of being less precise.
If we decided we wanted greater precision in our estimate we might calculate an interval that has a smaller margin of error such as we would get with a 90% confidence interval. Like for the 95% interval, the only difference is in the critical Z value (1.645). The resulting interval is 78.16 pounds to 101.84 pounds. Try the calculation yourself!
PRACTICE PROBLEM #1
Establish a 95% confidence interval for a group of 15 subjects with a mean of 70 and a standard deviation of 15.