Confidence Intervals and Single Population means with t
Now consider the case in which a normal distribution would be appropriate, but you don't know the standard deviation of the population. When we don't know the population standard deviation the best we can do is use the sample standard deviation as our best guess. But since we are now estimating the amount of variability we could encounter from sample to sample, we need to modify our confidence interval procedure to accommodate the fact that we don't know quite as much as we would like. The solution to this problem is to replace the normal distribution we used previously with the t-distribution, which is a little bit wider than the normal distribution.
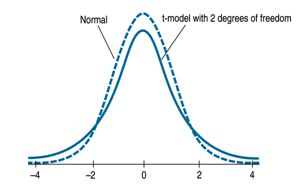
The t-distribution is actually a family of curves that differ by a characteristic called "degrees of freedom." Each of these curves resembles the normal distribution, but are a little bit wider in the tails. As the number of degrees of freedom increase, the t-distribution looks more and more like a normal distribution.
The basic construction of the confidence interval is the same as for the Z interval:
![]()
What has changed is the make-up of the margin of error. Since we don't know the population standard deviation σ the best guess we can make for this value is the sample standard deviation s. So now we compute what is called the standard error of the mean:

The margin of error then is:
![]()
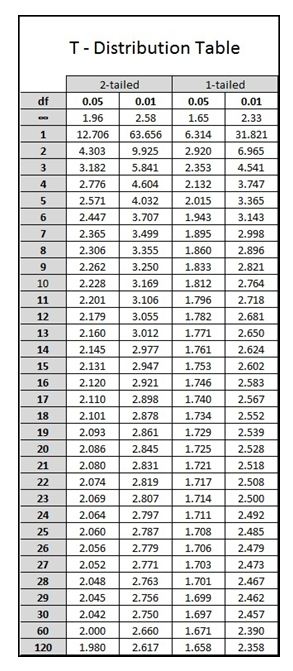
Where the value of the critical tc is determined from a table (or software) and has degrees of freedom = n - 1, so unlike the Z-interval, the critical value for any given level of confidence depends on the size of the sample. Use a table of critical t values (or software) like the one below to select the proper value for the margin of error calculation.
Finally, the boundaries of the confidence interval are:
Lower Limit = 90 - 14.11 = 75.89
Upper Limit = 90 + 14.11 = 104.11
For our example lets assume that the weights of 10 eleven year old children with the following scores. We will need to find S so we can fill in the formulas and estimate the range for the actual population mean.
| 65 | 70 | 72 | 76 | 80 | 55 | 69 | 64 | 59 | 60 |
Using what you learned in module 1, what is the S and what is the mean? ANSWER
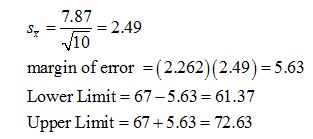
Based on these calculations, we can be 95% confident that the population mean is somewhere between 61.37 pounds and 72.63 pounds.
PRACTICE PROBLEM #2
For the following problem, assume that the score of 10 subjects were as follows. Establish a 99% confidence interval.
| 20 | 25 | 26 | 27 | 30 | 19 | 22 | 23 | 25 | 31 |