
Software Proficiency
Statistics & Risk Management
Software Proficiency
Statistics & Risk Management
In Module three, we conducted several t-tests by hand. Excel has the capability of conducting a two sample independent t-test. For this process, we are going to introduce a second data set (just for the t-test, we will go back to the previous data set for future sections.
| Test 1 | Test 2 |
| 31 | 18 |
| 20 | 17 |
| 18 | 14 |
| 17 | 11 |
| 9 | 10 |
| 8 | 7 |
| 10 | 5 |
| 7 | 6 |
| 15 | 16 |
| 19 | 20 |
The meaning behind these values is not important, for our example, we just want to determine if a difference exists between them.
In Excel, there are three two-sample t-tests, one for samples with unequal variance, one for samples with equal variance, and a third for paired samples. In this section, we will look at the first two options. The test for unequal variance is the most common test and the one you should generally choose. The assumption of unequal variances is more reasonable (if the populations are different in means, why would the variances be equal?) and is never wrong. It could lead to erroneous results, however, to assume equal variances when, in fact, that assumption is false. It is worth noting that in statistical software the default is generally for unequal variances. We will not be examining the paired samples option.
For our first run through, let's assume that the samples here have unequal variances.
From the menu bar, select Tools > Data Analysis > t-test > Two Sample Assuming Unequal Variances. Type in the input range for each of the diets into the dialogue box provided, then select the output range and click OK.
Variable 1 Range: $A$1:$A$11
Variable 2 Range: $B$1:$B$11
Make sure the labels box is checked if you include the column headings (preferred).Note there is a field in the dialog box for you to enter the "Hypothesized Mean Difference." The default value is 0, and this is probably the most usual value for the difference. However, it might be good practice to always fill in this field, even if it is almost always 0. Then if you ever need to test a hypothesized difference other than 0 you will be in the habit of making sure the test the difference you want. Your call.
Your output should look like:
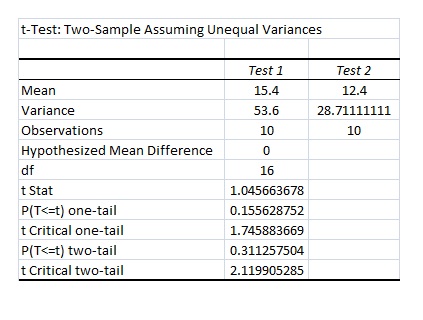
This printout gives us everything we will need to make a decision on this significance of this differences (if there is one). t Stat is our calculation t ratio. Below that you will see P(T<=t) one-tail. This is our p-value based on the t Critical for a one-tail hypothesis test (this is the next value) followed by the p values and the t Criticals for the two-tailed hypothesis test. Based on our results, our tests were not significant as either one- or two-tailed tests at either the 0.01 or 0.05 alpha levels.
A slightly more powerful test can be used if you can assume that the standard deviations are the same under both treatments. In Excel, this is done by selecting t-test: Two sample assuming equal variance in the Analysis ToolPak. For this data the results (and the set-up) are almost identical since the variances of the two samples are very similar. In general, this test produces a smaller confidence interval for the difference in means, shown by the p-value i.e. P(T<=t) two-tail.
Lets look at the same data set but now we will assume that they have equal variance.
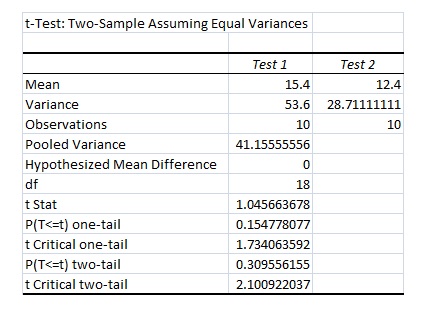
As you can see, the results did not change. We still do not have significant findings. Compare the two results outputs and you may be able to see how the second set of results will be more conservative (with the smaller confidence intervals).
Created with SoftChalk
mobile page
![]()