Regression
Statistics & Risk Management
Regression
Statistics & Risk Management
I came across a study the other day about a link between Positive Moods and Yoga. Participants of this study were asked to describe their mental state at several points throughout the study. Those practicing yoga regularly noted greater improvement with mood and decreased anxiety compared to those who walked. What does this tell us?
What is the relationship? Quite simply, from this statement we can assume that the researchers found a positive correlation between mood (let's hope it was a positive mood) and the practice of yoga.
Correlation is a statistic that describes the association between two quantitative variables (Note – when you have two variables and are studying the relationship between them we refer to the data as bivariate as opposed to univariate. Correlations can be either interclass or intraclass.
In module one, we discussed measures of central tendency and variability, and how they are used to summarize a single variable by providing important information about its distribution. Often, however, more than one variable is collected on each individual. With the use of correlations, we can delve further into an examination of descriptive statistics using multiple variables.
Most university admissions committees, for example, ask for an applicant's high school grade point average and SAT scores. If we were to calculate the correlation coefficient between these two points, we might (based on a commonly found correlation) see a correlation equal to 0.40. This is called the correlation coefficient. But what does this tell us?
The correlation coefficient gives us two important details. First, it will tell us the degree to which the variables are associated (correlated). Second, it will tell us the nature of this relationship.
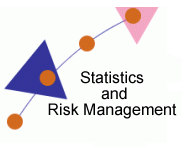
Let's look at this with the help of a scatterplot (as mentioned in module one).
In the above illustration, you can see that the correlation coefficient can be positive, negative, or it can have no relationship at all. A positive correlation coefficient means that as the value on the X axis increases, so does the value on the Y axis. A negative correlation coefficient demonstrates an opposite relationship. As the value on the X axis increases, the value on the Y axis decreases. If you find a relationship that is neither positive nor negative, then there is no relationship between the two variables. Scatterplots help us to quickly judge what type of relationship we have by imagining a line, the regression line, passing through our cluster of plots.
The slope of this line will give us the other half of the correlation coefficient's information, the degree to which our two variables are related. Again, looking at the above illustration you can see that the correlation coefficient can vary from -1 to +1. When judging the magnitude of the relationship, we are only concerned with the absolute value. So the magnitude of the observed relationship can vary from 0 (no relationship) to 1 (a perfect relationship). When it comes to magnitude, there is no difference between a +1 and a -1. They both indicate that X and Y will vary with a 1:1 ratio.
So what you can take from this introduction is that correlations are used to determine the relationship between variables (only two variables at at time with bivariate data), while regression will be used to predict outcomes based on changes in these variables.
PRACTICE PROBLEM #1
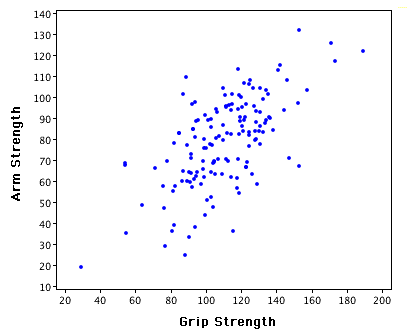
Does the following scatterplot show a positive or a negative correlation?
|
|
PRACTICE PROBLEM #2
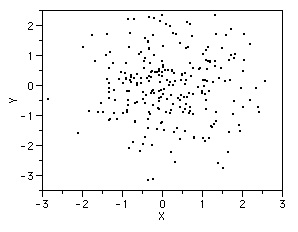
How about this one? Does it show a positive or a negative correlation?
Ok, this is all great fun and all, but how accurate can we be by just judging the scatterplots? In the remaining sections of this module, we will learn how to calculate the correlation coefficient with the Pearson Product moment and the regression line using linear regression.
Created with SoftChalk
mobile page
![]()