Chi square
One thing that all of our variables have had in common so far is that all are based on either interval, or ratio data. The next analysis that we will use in this module for hypothesis testing uses nominal data sets.
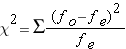
The Chi Square distribution can be used to test whether observed data differ significantly from theoretical expectations, Frequency observed ( ) vs. Frequency expected (
 ). For example, based on student enrollment, can we detect whether some courses are more popular than others? Examining the enrollment of 70 students in the psychology courses at a local university, we find that 17 students enrolled in Social Psychology, 35 students enrolled in Basic Statistical Analysis, and 18 students enrolled in the Psychology of Learning. Our null hypothesis should state that the number of students observed to be enrolled in courses should not differ from the frequency of students expected to be enrolled in these courses. To evaluate this null hypothesis, we are going to have to calculate the Chi Square
  :
:
Translated into something more manageable we get
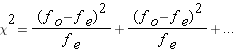 one term for every group in the analysis
Step by step it would look like this.
Step 1: calculate the frequency expected
The hypotheses of interest are:
 : there is no student preference for courses
 : there is a student preference for courses
If there is no preference among students for one course over another, then we would expect the enrollments in the courses to be the same:

So we expect the enrollment in each course to be 23.3 students. Of course, there can't actually be 23.3 students – we can't have a fraction of a student! But when calculating the expected number of students we generally carry out such calculations to the nearest tenth (i.e. one decimal digit).
We observe that the three courses actually have enrollments of 17, 35, and 18 students – clearly not the expected 23.3. So the question becomes "Are the actual enrollments significantly different from what we would expect if there was no student preference?" In other words, could the observed differences just be chance or is there more to this story?
The easiest way to work through the formula is to set up a table and work through each step one at a time. So far we have:
| Social | Stats | Learning | |
| fo | 17 | 35 | 18 |
| fe | 23.30 | 23.30 | 23.30 |
Step 2: calculate: and add it to the table
| Social | Stats | Learning | |
| fo | 17 | 35 | 18 |
| fe | 23.30 | 23.30 | 23.30 |
| fo- fe | -6.30 | 11.70 | -5.30 |
Step 3: calculate: and add it to the table
| Social | Stats | Learning | |
| fo | 17 | 35 | 18 |
| fe | 23.30 | 23.30 | 23.30 |
| fo- fe | -6.30 | 11.70 | -5.30 |
| (fo- fe)2 | 39.69 | 136.89 | 28.09 |
Step 4: calculate:and add it to the table
| Social | Stats | Learning | |
| fo | 17 | 35 | 18 |
| fe | 23.30 | 23.30 | 23.30 |
| fo- fe | -6.30 | 11.70 | -5.30 |
| (fo- fe)2 | 39.69 | 136.89 | 28.09 |
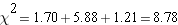
| (fo- fe)2/ fe | 1.70 | 5.88 | 1.21 |
Step 5: calculate the sum offor all your groups. This is

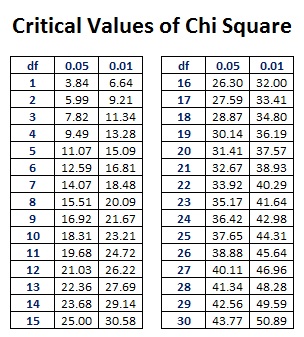
Step 6: compare the calculatedwith the critical
For the our df = K-1 where K is the number of categories (in this case k = 3 - the 3 classes)
For our example, df=2 at the alpha level of 0.05
Using the table below, what is our critical ?
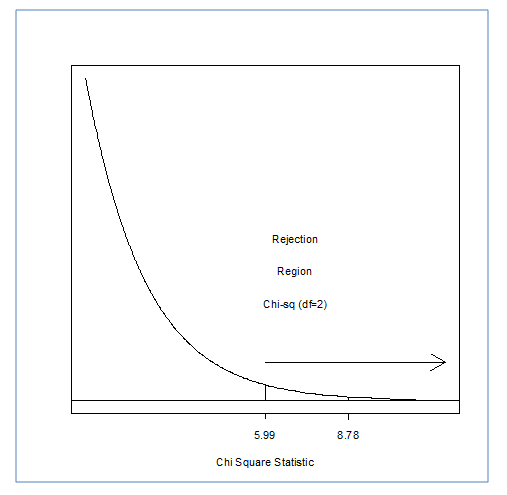
So one more time, before we move on...what is your decision?
PRACTICE PROBLEM 10
After research into traffic violations, a hypothesis was formed stating that police citations for traffic violations are a function of the age of the driver. A random sample of 100 drivers was selected from the population of cited traffic violators during a one-month period. The drivers were categorized according to age, and the frequencies for each category were established.
| 18-27 | 28-37 | 38-47 | 48-57 | 58 and Over |
| 35 | 25 | 15 | 13 | 12 |
Using the Chi Square procedure, evaluate the null hypothesis that there is no difference in traffic violations as a function of age of driver.